Saturday 31 October 2015

My Suggestion to Improve Postal Services in Singapore

When I was a child, I am always excited when my parents open the letter box, only to be disappointed that none of the letters belonged to me. Once in a while, my cousins and I exchanged seasonal greeting cards and receiving letters was fun.

Nowadays, with advancement of technologies, shopping online is made possible. I have made several purchases that were delivered into my mailbox. Although the hype of receiving stuff in the mailbox has died down pretty much, I still find it cool to be receiving items other than letters through post.

Recently on 28 October 2015, Singapore Post announced that they will transform the concourse in front of their Singapore Post Center at Paya Lebar into a 5 storey, 25,000 sqm retail mall that will be completed by mid 2017. What is so special about this mall is that shoppers who bought from the retailer can have their purchases delivered to their homes.

While this is an exciting development for a lazy shopper like myself, I do have a few bones to pick with the postage service in Singapore.

No doubt, one can arguably agree that the postage service in Singapore is world class. But with the development of technology, I am sure it is about time we see some upgrades to how mails are delivered.

For those who are not familiar with what SingPost has to offer, you can visit their website to have a look: https://www.singpost.com/.

BONES TO PICK
I would like to touch on the plain old delivery of letters. It is not uncommon to find letters that belong to a neighbour in your letter box. If I am in a good mood, I will personally go their front door and leave the wrongly delivered letter there. Otherwise, I'll just chuck it somewhere at the letter box area for all to see.

If I am receiving letters delivered to the wrong address, it brings to mind the possibility that MY letters could have fallen into the wrong hands as well. What if that letter contains important or extremely sensitive information and the person who got it did not have the integrity to return it? Or it is an actionable item that has dire consequences if ignored?

I am not criticising the postman for making mistakes time to time. I understand that it is human nature to make mistakes some times. What I am going to propose is a possible fix with the help of technology.

Another issue that I have a problem with is the delivery timing of tracked parcels. The most plausible reason why one would opt for parcels to be delivered to the doorstep instead of those self-retrieval boxes is because one does not have the time to go and pick up the items at a specific location. However, the delivery date of the tracked parcels is usually unknown, making it difficult to anticipate when one would need to have someone at home to receive the parcel.

Then comes the problem of delivery timing, which is on weekdays and during working hours, which contradicted the very reason why someone needs an item to be delivered to the doorstep. If the recipient is so free to be at home the entire time waiting for the parcel, why would the service still be required? The end result is a slip of a paper asking the recipient to collect it at the nearest post office. What was the point of paying for the service if I have to collect it myself again?

THE FIX

The solution I am going to propose will not only increases the accuracy with which letters can be retrieved, it can revolutionise the way how our posts are delivered, opening up more possibilities with improved convenience. This solution also changes the role of postman, which will resolve manpower issues and make their job a whole lot easier.

Instead of having one letter box to each household, which limits the size of the mail box and takes up too much dead space. A new-age mailbox can allow automatic retrieval of postage without requiring the post man to sort and deliver. The entire delivery process is mechanised and the sorting is done by a machine via scanning of barcodes/QR codes.

All that the postman needs to do is to deliver a automation-enabled container full of items to be delivered, plug it into the new-age mailbox located at every void deck, key in some verification code and ensure that the system recognises the container, retrieve the container from the day before, and be on his way. The returned container can contain items that users wish to deliver, eliminating the need for letterboxes around the island that their sole purpose is to collect lett
ers to be posted. Sending and receiving postage can be done at the void deck!

The new-age mailbox will then do its sorting internally and scans the barcode on every item to get an inventory of the items delivered. The scanned items can be feedback to headquarters for tracking purposes to confirm that items' status and location. This method of tracking can allow all users to purchase information on the location of their items without actually opting for tracking services before delivery.

Everyone who wants to retrieve their posts need to register for an account. Each account will need to maintain a balance for deduction of postage fees. Postage fees can now be transferred from the sender to the receiver where applicable and additional costs can be charged for any special services incurred.

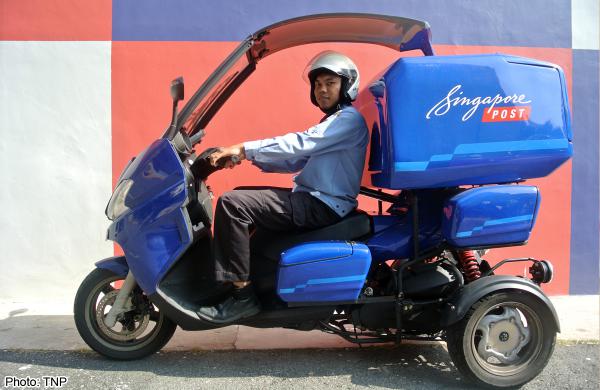
Imagine a counter at your void deck with maybe 3 mailboxes that looks like microwave ovens. The user punches in a verification code or taps a key card at any of the mailboxes and the system does a search for the user's items. If there are items for the user, the system will transfer the item from its storage into the mailbox where the user can retrieve it.

With the new-age mailbox, the size of the mailbox is no longer limited to the cumulative space needed for all the household. The bulk of space needed will be for holding the inventories in the storage. Users can now have bigger items delivered to their void decks with the assurance that it is accurately delivered and if need be, track the delivery status online.

One other possibility of the new-age mailbox is for users to purchase daily non-perishables necessities. The storage can hold items such as batteries, bandages, adhesive tapes, etc for emergency uses. E-commerce would be upgraded and merchants who wish to advertise can forget about flyers and go through the media player on the mailbox to broadcast their advertisement to users while they wait for their items to be retrieved. This will become a new targeted advertising since the profile of the user is tagged to the account and is known to the system.

DOWNSIDE?
The one biggest downside of course would be the development and implementation costs. But think about this, 20 years ago, elevators serving residents of HDB only stops at 3, at most 4 levels. Today, they stop at EVERY level! Was it costly to implement? Yes! But was it necessary to improve lives? YES! So cost should not be an inhibiting factor to improving the lives of the people.

Moreover, the possibilities that this new-age mailbox opens up is a multitude of new revenue generating segments that pays for the development itself!

All users can start selling items from their homes, increasing postage revenue, or allowing SingPost to draw a commission for the items purchased through the mailbox. The minimum balance that every account needs to have will become free float for SingPost to earn additional returns and perhaps enter into the insurance business. Each mailbox becomes a remote commercial retail center and shoppers can truly conduct a hybrid of physical and online shopping with the peace of mind! Imagine the possibilities.

Cost cutting can be execute with exponential improvement to speed and accuracy of delivery.

The only way forward, is to advance technologically.


Do let me know of your thoughts on my idea, whether you think it is feasible or whether you agree with its possibilities in the comments section.


Sunday 18 October 2015

Creating an Artificial Intelligence Investment System

When I was first exposed to the concept of quantitative value strategy and was really excited about it. Recently, I realised that such strategy is already prominently practiced in the market under the name of smart beta. Smart beta strategies basically aim to outperform the capitalization-weighted market based on factors such as value, size, momentum, and volatility. The strategies boasts superior and consistent returns based on positive back testing results on historical data.

Then there is smart alpha, a strategy that is ever evolving and proprietary to the creator. While smart beta is backward looking, transparent, methodological and predictable, smart alpha is forward looking, versatile, dynamic, and evolutionary.

I was intrigued by the possibility of building a system that can tell me when to buy or sell what investments. All I need to do is to let the system do its job while I can truly live my life.

The concept is similar to creating an Artificial Intelligence not unlike a Chess AI. For every move you make, the AI will extrapolate every single possible moves to achieve the ultimate outcome of checkmating your king.

Your "chess moves" will be akin to the movements in the market such as changes in interest rates, or the flow of money in/out of various asset classes etc. The outcome of "Checkmate" will be akin to generating the highest return possible at the highest probability rate trade off.

The best part of this AI is its ability to learn from both historical and future events and adjusts its calculations of probability and re-calibrate its strategy accordingly.

AI that can think and learn is no longer something in a science fiction but very real in our world today. There is only so much a human brain can process and we are also highly susceptible to our own biases that we allow emotions to rules over logic.

I believe this is a worthwhile pursuit and would be devoting a part of my time towards this end goal.

Monday 5 October 2015

T T J HOLDINGS LIMITED [K1Q.SI] - 2015 Result Announcement

At the start of the year, I posted my first company analysis on this blog, which I have deemed as high quality and undervalued. With a financial year ended 31 July 2015, TTJ Holdings released their full year financial statement and announced their proposed dividend recently on 23 September 2015.

Shares of TTJ spiked from an immobile range of $0.32~$0.34 for the 1st 3/4 of the year, to a closing high of $0.385 on 28 Sept 2015. One of the most likely reason for the spike was because of the proposed dividend of $0.08, which represents a yield of 21% based on the current price of $0.37, or 24% if you have invested at the price of $0.33. This means that for every $10,000 that you have invested in TTJ, you would be getting up to more than $2,400 worth of dividend come 1st December 2015.

Not that I am showing off, but I believe in celebrating every little success just as how I have been very candid with my mistakes. In all, I have purchased close to 60,000 shares of TTJ in 2 separate purchases. My average cost was approximately $0.335 per share after commission charges. If I liquidate all of my shareholdings at the current price, I will net a gain of around $2,000 or 10% return on investment (ROI). However, I intend to continue holding these shares and earn the 24% ROI when the dividend is paid, translating to approximately $4.8k for a years of not doing any work.

The reason why I am holding on to this share is written in my article, where I indicated that the company is severely undervalued, with an intrinsic value of $0.51. Although the reported net income is lower than my forecast, its 2015 annual report still indicates that the company has strong sustainable profit and good fundamentals.

I especially like how this company operates on virtually no debt. The high dividend payout is of no surprise considering that it is sitting on a large pile of cash. Its cash and cash equivalent represents 55% of its total assets or 65% of equity. Capex this year was half of last year so I believe the company is scaling back to observe how the economy will play out. It has also liquidated more financial assets than last year without purchasing much this year. A prudent company returns cash to investors if it is unable to generate higher returns than the market. This further strengthens my confidence in TTJ's management in directing the company through this uncertainty.

As they say, in an uncertain economic environment, cash is king! Hence, I believe TTJ will be able to utilize its large cash reserves to invest in other undervalued assets or participate in many high return projects that its competitors may not be to do so without borrowing more money.

Sunday 6 September 2015

Stock Investment Mistakes Log - 05 Sept 2015

Recently, I have the fortunes to meet Mr Royston Yang, Financial Analyst at EFA Group, the famous blogger of http://sgmusicwhiz.blogspot.sg/ over coffee where he shared with me valuable insights and wisdom of how he approached Value investing.

One of the good practice that he did on his learning journey is to blog about the mistakes that he made along the way. It is very easy to brag about one's success to make one look good, but it is the mistakes that one makes and the courage to own up that separates an honest person from someone who is superficial.

Although this is not my first post about my mistakes (check out My Investment Journey), the posts in this series will specifically be written with regards to my stock investment journey. This will serve as a reminder to myself not to repeat such mistakes.

In the recent market crash that occurred in August 2015 when the Chinese government suddenly allowed the RMB to devalue freely, one of my largest speculative positions took a big hit. That position continued to spiral downwards and has been causing me anxiety. The following passage will describe my mistake details.

If you have read my post titled: Diamond in the Rough, you would know that I have very high regards for this company called Sarine Technologies [U77]. In the conclusion of my post, I stated that my valuation of this company indicated that the current price is overvalued. But I also added that those who wish to speculate on the chance that the shares will bounce back after suddenly dipping from a high of $3.23 to a low of $2.

Being tempted by the possibility that the share price would bounce back, I decided to take a position in the stock.

A little background on how I place my trades:

In order to maximise the trading commission that I have to pay, I have made it a rule for myself to not make any transaction that is less than $9,000 in value. This is because, the commission charged by most internet broker platform is 0.00275% of the transaction value or $25, whichever is higher. If I make any trade that is less than $9,000 in value, I would still have to pay $25, thereby increasing the per share cost. This cost might seem negligible to you but over time, it will erode the overall gain that I could have realised.

I would never purchase shares at the current asking price, instead, I would place a buy order at a price lower than the current bid right before the market opens and wait for the orders to be filled by sudden sell offs.

Mistake 1

It was ex-dividend day for the share and the price dropped to factor for the dividend paid out. The buy order that I have placed was for the price that took into account for the dividend. The moment the market opened, my order was filled because I placed the buy order too high. Within the day, the price of the share dropped further. If I had done my homework properly, I could have purchased the stock at a much lower price. I bought 5000 shares for $2.05 when I could have gotten it at below $2.

Mistake 2 

Because the share price kept falling, I panicked and wanted to average down my cost. I placed another buy order for 5000 shares at $2. In a single day, I purchased $20,300 worth of Sarine Technologies shares because I did not do my research properly and because I panicked.

Mistake 3

The above mistakes could have been triumphs if not for my greed. As I speculated, Sarine Technology's share price rebounded after 2 months from my purchase. From a low of $1.95, it went back up to $2.35 due to some positive news released by the company. However, I told myself that I would only sell if the price went up to $2.50. It was a big mistake. I should had heeded my own calculations which told me that the share price was already overvalued, and exited the moment I was ahead. I could have netted a gain of $3,000 in 2 months.

But because of the deterioration in global market condition in August, the share price started free falling. Sarine Technology is trading at $1.32 as of this post.

Mistake 4
As the share price was falling, I made the mistake of trying to average out the cost by buying too pre-maturely instead of waiting until the share price stabilized. When I could have averaged the cost of my overall purchase from $2.03 to $1.70, I used my capital to only lower the average cost to $1.90.

Mistake 5
Although buying this company presented an opportunity to make a quick profit, it was against my established strategy of only buying a share if it is trading below the intrinsic value that I have calculated. The mistakes made that caused me anxiety could have been averted if I had the discipline to follow my strategy.


Monday 31 August 2015

Financial Statement 101 - Depreciation and Amortization Expenses

Depreciation and Amortization (DA) is the methods used to pro-rate the cost of a specific type of asset to the asset's life. It "smooths" a large Capital Expenditure (CAPEX) over time rather than recognizing the expense at the specific time of purchase.

According to Economic definition, depreciation is the amount of a company's operating cash flow that must be reinvested in the company to sustain its real cash flow at the current level.

By Accounting definition, it is the amount of the original acquisition cost of an asset that is allocated to each accounting period over an arbitrarily specific life of the asset.

To illustrate the Accounting definition:

Say you are in a business selling drinking water. You bought a cup for $10 and you think that it can last your business for 10 years before it becomes unusable. This cup is classified under Plant, Property & Equipment (PP&E) which is the long term asset that you use to run your business. And the cost incurred to purchase PP&E is classified as CAPEX

In the first year of your business, say you used the cup to make a revenue of $20. Assuming that the operating expenses of your business, which include the water that you are selling and the rental of the stall costs $5. After deducting operating expenses, your Earnings Before Interest, Taxes, Depreciation & Amortization (EBITDA) would be $15.

Revenue: $20
Operating Expenses: $5
EBITDA: $15

Despite incurring the cost of $10 for the cup upfront, if you charge the expense under Operating Expense, you would severely understate your net profit for the first year because the cup is still usable and still possess some value to your business at the end of the financial year. In the subsequent years, because you no longer need to purchase more cups, you would overstate your profits by not taking into account the cost of the cup that contribute to your revenue. Get the picture?

Hence, DA estimates by Accounting definition contains some major flaws.

Firstly, the per year DA charges is determined based on the accountant or the company's estimate of  how long an asset will last, usually over an uncertainly long period of time. If their estimated usable years is too long and the PP&E actually lasted only much shorter, they would have overstated each year's profit up till the point where the asset is no longer usable. Because they would have to incur more CAPEX, earlier than the expected useful period of the previous asset.

Secondly, because DA is based on historical costs rather than the current replacement cost of assets, measured DA in periods of inflation is understated relative to the replacement costs, causing actual profits to be overstated correspondingly.

Thirdly, some assets becomes obsolete much faster than expected and have to be replaced despite being still usable. Examples include computers or technological equipment that are evolving at such rapid rates that not replacing them with newer products simply spell doom for the business. The cost to replace these assets would not be accurately captured in the income statement as the DA estimates for the replacement would be subjected to the same flaws above, resulting in perpetual under or overstatement of actual profits.

Lastly, because of the elasticity in which the expense can be booked, this cost is subjected to earnings manipulation to either help the company pay lesser taxes or to make a bad financial year look less serious.

Hence, Warren Buffett has created a formula called Owner Earnings to address the issue of inaccurate net profit figures reported in the Income Statement.

How To Start Investing in the Stock Market [Part 3] Reading Financial Statements

Ever wonder how do fundamental investors determine whether a company is worth buying?

The answer lies in the financial statement of a company's annual report (AR).

After you have learnt how to screen for stocks, the next step is to read these company's financial statements so that you can analyse and find real good companies to buy.

In part 3 of How to Start Investing in the Stock Market series, I am going to share with you some of the really basic but important components in the financial statement.

Finding Annual Reports of Public Listed Companies in Singapore

You can either Google it, or you can use the wonderful database of SGX via this link:
http://www.sgx.com/wps/portal/sgxweb/home/company_disclosure/annual_financial

Select the reporting period, choose to search based on the "Company Name" or the stock code, select "Annual Report" as the report type and click "Go".


Click on Annual Report link in the search result and a window will pop up. By clicking on attachment links, the annual report will be loaded on the web. However, if you would like to save the AR for future reference, you can right click on the link and select "Save link as..."

Now that you have managed to get your hands on your AR, let's take a look at what is inside.

In a typical AR, you can usually find the following components:
  1. Company's performance in a snap shot 
  2. Chairman's Statement
  3. Financial Statements
  4. Notes to Financial Statement
  5. Shareholding Information
I recommend that you invest some time to read the entire report of a company just to get a feel of what information is available inside. Do this for a few different companies. Compare a company's past year AR and see if you can get a feel of whether the reporting format has dramatically changed. Read what the chairman said about the direction of the company 10 years ago and compare it with today to see if what he said actually happened. This gives you a sense of how credible is the management of the company.

What I am going to focus on in this article will be the "Financial Statement" portion of the AR and a little of the Notes to Financial Statement.

Do bear in mind that I will not be able to cover in detail the entire financial statement, but can only help you get started on navigating it.

The financial statement consists of many components. What you need to focus on is just 4 parts:
  1. Income Statement
  2. Balance Sheet
  3. Cash flow Statement 
  4. Notes to Financial Statement
1. INCOME STATEMENT
The Income Statement is a summary of the company's profitability over the past 12 months.

Depending on the Accounting firm that does the reporting, as well as a country's generally accepted way of reporting accounts, the terms and presentation method in each company's AR can be very different. Don't worry if you see different terms from those that I have mentioned in the article. Search the term on the internet and you will be able find their equivalent counterpart.

1.1. Revenue
At the top of the statement, you can see the Revenue/Sales which is the total amount of income generate for the whole year. It is said that the Revenue figure is the figure that has the least possibility of being manipulated compared to other figures.

What you want to see here is that there is growth in the revenue numbers year-over-year (y-o-y) for the past 5 years.

Different companies have different sources of income stream. Find out what are the sources of income for the company that you are analysing and look at the trend of growth for individual components. If you are looking at 10 years of data, you might find that new sources of income have been added over the years. This may or may not be a good thing. For one, it helps you to identify the institutional imperative tendencies of management to jump into a "hot" sector even though it does not have any expertise or experience at all. Avoid such company at all cost.

However, contrasting from institutional imperative is the ability of management to exit dying sectors and moving on to emerging frontiers of their industry. This continuous improvement process is very important for the sustainability of a company. These are companies that you would want to own.

1.2. Business Expenses
After revenue, comes the expenses incurred for running the business. There are many terms in which expenses is expressed. Some breaks down expenses into Operating and Non-Operating expense, while some differentiates costs by Cost of Goods Sold (COGS) or Selling, General & Administrative Expense (SG&A), or they can be classified as Variable or Fixed Costs.

1.2.1. COGS/Variable Cost
COGS is the sum of the unit cost of each product or service sold, meaning this expense increases in proportion to the revenue number. The more product or services sold, the higher the COGS. They include items like raw materials cost, manufacturing costs, packaging cost, delivery costs, etc. One thing to note is that the guidelines for classifying COGS is very grey, hence, companies can easily manipulate this item.

  • Gross Profit = Revenue - COGS
  • Gross Profit Margin = Gross Profit / Revenue
    *I will be going through more in depth about the ratios and what they mean in the next article of this series

1.2.2. SG&A / Fixed Cost
SG&A, fixed cost or overhead expense is generally the same regardless of the revenue in the short run. These costs include items such as marketing & advertising, plant property & equipment rental, employee wages, legal & professional fees etc.

What you want to see is that company exercises discipline for their SG&A without increasing the cost by too much. However, some companies may artificially reduce their SG&A to make profit look higher. These are the companies to avoid.

1.3. Charges
One off events to factor for unforeseen circumstances in the business such as write-offs for unsalable inventories or disposal of division, etc. It is reasonable for companies to not include such charges to the expense but you would want to look out for frequent charges that is happening every year. This might be a sign that the company is in trouble. Frequent inventory write offs could be a sign that the company's products are no longer in demand.

1.4. Depreciation and Amortization 

After the expenses, comes the term called Depreciation and Amortization. Click on the link to find out more about this item on the Income Statement.

1.5. Interest Expense

After DA is the Interest Expense which is the cost of debt or borrowed money. The more money that a company borrows, the higher the interest expense. As the company is obligated to repay its debts regardless of how well the business has done, when the company is unable to repay or refinance its debts, it will be forced to sell off its assets or forced to become bankrupt.

Companies that have very high level of debt  do very well in good economic conditions as they have very high return on equity, but they are affected the most in a rising interest environment or when the economy is slowing down. Hence, interest expense is the greatest risks that can cause an investment to become dust.

1.6. Taxes
Taxes can be quite complicated and tedious to understand, especially if a company has operations or subsidiaries in many countries. What you need to pay attention to is the deferred tax, a decrease in deferred tax could be a sign that the company is not expecting to make profits in future. The tax rate that the company is subjected to can be found in the notes section of the AR.


2. BALANCE SHEET
The Balance Sheet is the statement of the assets, liabilities, and capital of the company at a particular point in time, detailing the balance of income and expenditure over the preceding period.

2.1. Assets
This is what the company owns and is separated into 2 broad categories: Current Assets & Non-Current Assets

2.1.1 Current Assets
These are assets that can be easily converted into cash within 1 year. They include items such as Cash & Cash Equivalent, Marketable Securities, Account Receivables, Inventories.

2.1.2 Non-Current Assets
These are long term assets that the company will own for more than 1 year. They include items such as plant, property and equipment, investments, and intangible assets such as good will, branding etc.

2.2. Liabilities
This is what the company is obligated to repay. Similar to Assets, Liabilities are also separated into Current Liabilities and Non-Current Liabilities

2.2.1 Current Liabilities
This includes items that needs to be repaid within 1 year such as short term debt and current portion of long term debt, Accounts payable, Income tax payable

2.2.2 Non-Current Liabilities
This includes items that does not need to be repaid within 1 year such as long-term debt and deferred taxes.

2.3. Equities
Equity is what the company is worth after deducting all liabilities from all assets. There are 3 types of equity:  1) Preferred stockholders' equity, 2) Common stockholders' equity, 3) Retained earnings.

2.3.1 Preferred Stockholder's Equity
Capital that is raised from the sale of preferred share is classified under this category. Preferred share
is a combination between a bond and a common stock. It has a fixed dividend payout that is similar to interest paid on bonds and each preferred share does not have any voting rights, however unlike bonds, if a company is not doing well and is unable to pay out any dividends, it can choose to withhold the dividend until its business improve again.

2.3.2 Common Stockholder's Equity
These are capital raised from shareholders of common stock either through IPOs, or the exercise of options issued by the company. If you bought shares from the secondary market, you become a common stockholder but what you paid for the share merely goes to the previous owner of the shares rather than the company.

2.3.3 Retained Earnings
This form of capital is the accumulated profit that the company retains after distributing dividends each year. A growing trend of retained earnings is a sign that the company is truly profitable.


3. CASH FLOW STATEMENT
The Cash Flow Statement measures the cash generated or used by a company in a given period. It has 3 main components: 1) Cash flow from Operating Activities, 2) Cash Flow from Investing Activities, 3) Cash Flow from Financing Activities

3.1 Operating Cash Flow
This is the cash flow from the main business itself. Starting from the net income, several adjustments from the income statement is worked backwards to arrive at the actually cash flow that is generated from the business. As some of the adjustments such as depreciation and amortization are non-cash charges, adding them back to the net profit figure and deducting the real costs from capital expenditure (CAPEX) can give you a better picture of how much money that company actually made after cost.

It is important to analyse the changes in working capital to determine how a company is managing its operating cash flows. If inventory is increasing y-o-y, it could be a sign that there is poor inventory management or that the company simply could not sell its goods. If account receivables are increasing, although this translates into increasing revenue, it could also mean that the company could be too aggressive with its sales and could potentially not be able to collect the money from its customers.

3.2 Investing Cash Flow
This is the cash flow that is used for making purchases of capital assets (also known as CAPEX). Purchases made under Capex adds to the plant, property and equipment on the balance sheet after deducting the depreciation and amortization cost. Increase in Capex can be a sign that the company is expanding, which usually translates into higher revenue. By comparing depreciation and amortization against Capex, we can get a sense of whether the company has been overly devaluing their assets to report lower earnings in order to pay lower taxes.

3.3 Financing Cash Flow
This is the cash flow that is for the financing of the company's capital structure. It could be cash raised from issuance of more common shares or the increase in bank borrowings vice versa. Dividends paid to shareholders also falls under this category.


4. NOTES TO FINANCIAL STATEMENT
This section contains very detailed breakdowns, justifications, assumptions, and rates that the company used to derive the financial statement report. Notice that there are some small numbers beside some of the items on the financial statement which denotes that there are notes available. These notes provides further explanation of how the figure is obtained. Do spend some time to study the notes as they often provide insights on how candid is the management on reporting their business to shareholders.


CONCLUSION
Fundamental investors look at the figures reported in the financial statement to help them paint the picture of a company's health. This article had shown you how to find annual reports of companies and introduced the more important components to study. By looking at the 3 different statements and making assessment based on the trend of the numbers or the ratios that various item derives, one can compare between companies and determine the better company to invest in.


Once you are comfortable in navigating the financial statement, let us move on to the next stage where we can make more sense of these numbers. Stay tuned for the next part where I will be going through some of the basic financial ratios that tells a story about the company.

Thank you for reading. If you have any comments or feedback, please post them in the comment section below or drop me an email at ohhanwee@gmail.com.


<< Part 2: Screening Stocks
Part 4: Understanding Financial Ratios (Coming soon...)>>


Disclaimer
I do not own any of the images used in this article.
This publication is for general reading only. The information and materials contained on this web site are subject to change without notice, are provided for general information only and should not be used as a basis for making investment decisions. It does not form part of any offer or recommendation, or have any regard to the investment objectives, financial situation or needs of any specific person. Before committing to an investment, please seek advice from a financial or other professional adviser regarding the suitability of the product for you and read the relevant product offer documents. I am not liability and will not be liable for any loss or damage arising directly or indirectly (including special, incidental or consequential loss or damage) from your use of this web site, howsoever arising, including any loss, damage or expense arising from, but not limited to, any defect, error, imperfection, fault, omission, mistake or inaccuracy with this web site, its contents or associated services, or due to any unavailability of the web site or any part thereof or any contents or associated services.

Tuesday 11 August 2015

How To Start Investing in the Stock Market [Part 2] Screening Stocks

After you have opened a securities and brokerage account, how do you go about picking a stock to buy?

To find a needle in a haystack, you need to at least know how the needle looks like. Alternatively, you can use a really powerful magnet, assuming the needle is made of iron.

Why am I talking about needles? More specifically, I am talking about finding something in a really really big place.

There are more than 700 companies that are listed on the Singapore Exchange (SGX), so how do we differentiate these companies from one another?

By using the stock code of course!

When a company is listed on SGX, it is assigned a stock code. Unlike America's Stock Exchange where the stock codes sometimes bear semblance to the Company's name (AAPL for Apple Inc, MSFT for Microsoft), SGX stock codes can be quite non-intuitive.

So how do you know what is the stock codes of a public listed companies?

You can use a relatively new feature on SGX's website known as Stockfacts. It is a stock search engine cum screener that allows you to filter out companies based on customised criteria. SGX Stockfacts can be accessed via this link:  http://www.sgx.com/wps/portal/sgxweb/home/company_disclosure/stockfacts

Once you access the link, you will see the Search function where you can enter the company's name and begin your search. Go ahead and input a public company that you can remember off hand.


If I search for the word "Singapore", Stockfacts will return all companies that has the word "Singapore" in their name.


Go ahead and click on one company. A company snapshot will be loaded. (Note: If your search keyword returns only 1 result, the company snapshot will be automatically loaded instead of the search result page above)

You will be able to find many useful information on this page such as Historical Share Price, Latest news on the company, Overview, Company Description, Valuation, Financials, Dividend history, Substantial Shareholders, Consensus recommendation & Target Share Price, and also SGX's new product called Capital IQ.

As a word of caution, do not take the consensus price too seriously. Although they are the consensus of what many industry experts think about the value of the company, do bear in mind that the livelihood of these so called experts depend on how credible they appear to be, so expect them to be part of the herd and provide estimates not too far from the current price.

If the consensus price is so accurate, the market would no longer be required.

Earlier, I talked about searching for a needle in a haystack, so now I am going to show you how to use a magnet to find the needle.

Go back to the Stockfact main menu and take a look at the interactive Search Criteria box.


You will be able to customise your search criteria to filter out companies that are not worth your time. Depending on your investment strategy, your search criteria can be very different from the next person beside you.

 The filtered results will be automatically updated as you change the criteria.

One of the limitations of this screener is that I am only able to use the slider instead of entering a round figure. Another limitation is that you are only able to select up to 5 criteria.

Below is the search criteria that I use.

  • 5-Year Revenue Growth of more than 5%
  • Return on Equity of more than 15%
  • Debt to Equity Ratio of less than 50%


Based on just the 3 criteria alone, Stockfact screener has managed to narrow down the 700+ companies to 23 companies.

This not only makes the task of finding a good company much easier, it also saves me a lot of time and effort

Some of the 23 companies that was on the screen are actually featured in my article of Very Good Companies with Strong Fundamentals

Now you can go ahead and play around with the screener and explore the company snapshot page.

If you would like to explore other stock screeners, you can check them out at the Useful Links page.

Stay tuned for the next part where I will be going through the basics of how to read the Financial Report.

Thank you for reading. If you have any comments or feedback, please post them in the comment section below or drop me an email at ohhanwee@gmail.com.


<< Part 1: Opening a Shares Trading Account


Disclaimer
I do not own any of the images used in this article.
This publication is for general reading only. The information and materials contained on this web site are subject to change without notice, are provided for general information only and should not be used as a basis for making investment decisions. It does not form part of any offer or recommendation, or have any regard to the investment objectives, financial situation or needs of any specific person. Before committing to an investment, please seek advice from a financial or other professional adviser regarding the suitability of the product for you and read the relevant product offer documents. I am not liability and will not be liable for any loss or damage arising directly or indirectly (including special, incidental or consequential loss or damage) from your use of this web site, howsoever arising, including any loss, damage or expense arising from, but not limited to, any defect, error, imperfection, fault, omission, mistake or inaccuracy with this web site, its contents or associated services, or due to any unavailability of the web site or any part thereof or any contents or associated services.

Monday 10 August 2015

How To Start Investing in the Stock Market [Part 1] Opening a Shares Trading Account

Learn to make money work for you, or you will forever be working for money.

Sounds easy? But how?

Making money work for you so that it may create more money is known as Investing.
Here is my article on the definition of Investing

So how do I start learning about investing?

You can read books, attend free seminars, pay for courses sold during the free seminars, or watch TV. In essence, you just need to keep a look out for any avenue where you can learn about investing and actively stick yourself out to learn about it.
Check out how I started investing

Personally, I find that buying shares is the most affordable option to invest my money. With as little as $1,000, I can easily buy a piece of a company that I want.

It is also the option that can allow the most diversification. I can buy Real Estate Investment Trusts (REITs) if I want to have exposure in the real estate market. I can buy Exchange Traded Funds (ETFs) if I want to follow a benchmark index like the Straits Times Index (STI); or I can buy an ETF that tracks commodity prices without actually owning any commodity.

Buying shares is easy and convenient. I can complete a transaction within minutes while I am on my way to work.

To start buying shares, you need a direct securities account.

In Singapore, the account where the shares that you own is held, is known as the Central Depository (Pte) Ltd account (CDP account). The market where you buy or sell shares is the Singapore Exchange (SGX). You can find out more about SGX and how it works here.

You will also need a broker to buy or sell shares on your behalf.

If you are picturing yourself picking up a phone and talking to a well dressed gentleman over at the other end of the line while you place your order, it is time to update that image.

In this age of information technology, human brokers are slowly becoming extinct! Where are the human rights group lobbying for brokers?!

In their place is the more efficient, more accurate, more convenient, and most importantly, more cost effective intermediary (middleman): the Electronic Broker!

You can choose to transact either over an online platform or through a smartphone application.

In Singapore, there are many such brokers to choose from. You can easily find many articles comparing the different account types and the cost involved.

Personally, I am using iOCBC trading platform and for 2 reasons:
1) It is linked to one of my OCBC savings account so the payment of share purchase, proceeds from sale of shares, dividends etc is automatically credited into my account.
2) It is the first account that I have opened and since the minimum commission among all similar platform are the same, I have no motivation to change (I will switch if the minimum trading commission is lower than $25 per transaction)

If you want to choose iOCBC as your broker, simply walk into any OCBC branch and tell them you want to open a stock trading account.
Or you can visit http://portal.iocbc.com/Accounts/basic-securities-trading-account.html

So what about the CDP account previously mentioned?

Worry not, you will be asked to create a CDP account when you apply for a stock brokerage account for the first time. You can have many brokerage accounts but you will only need 1 CDP account.

It may take up to a week for your account to be ready. You'll be receiving many letters with lots of redundant messages and brochures and passwords etc. What happened to going electronic?

Once your account is ready, you can start placing your first trade and be on your way towards becoming a millionaire!

You can check out the next article in this series of How to Start Investing in the Stock Market where I will be talking about finding good stocks among many.

Thank you for reading. If you have any comments or feedback, please post them in the comment section below or drop me an email at ohhanwee@gmail.com.


Disclaimer
I do not own any of the images used in this article.
This publication is for general reading only. The information and materials contained on this web site are subject to change without notice, are provided for general information only and should not be used as a basis for making investment decisions. It does not form part of any offer or recommendation, or have any regard to the investment objectives, financial situation or needs of any specific person. Before committing to an investment, please seek advice from a financial or other professional adviser regarding the suitability of the product for you and read the relevant product offer documents. I am not liability and will not be liable for any loss or damage arising directly or indirectly (including special, incidental or consequential loss or damage) from your use of this web site, howsoever arising, including any loss, damage or expense arising from, but not limited to, any defect, error, imperfection, fault, omission, mistake or inaccuracy with this web site, its contents or associated services, or due to any unavailability of the web site or any part thereof or any contents or associated services.

Sunday 7 June 2015

Behavioral Finance Checklist: Signals within the Inefficient Market

For the past 30 years, academics have been advocating the Efficient Market Hypothesis (EMH) and built many models around this theory to predict the market.

EMH essentially posits that the market will always correctly price all assets, and investors cannot make outsize profits to beat the illusive 'market portfolio' over the long run.

The greatest flaw of this theory is the assumption that humans are rationale regardless of any circumstance, and that institutions with their arsenal of extremely smart professionals will always drive market to become efficient. This cannot be further from truth and most of EMH and its related models have failed miserably in predicting the market.

This is because, human beings are creatures with emotions, built with survival instincts of self-preservation, and no amount of rationality can overcome our instincts. We tend to follow the crowd as that herd instinct gives us the illusion of safety in numbers. We tend to hold on to losers(stocks) as we hope that it will bounce back one day, resulting in much greater losses by selling too late. We tend to sell our winners too early for fear of losing the gains we have made, only to see the stock climb ever higher. To put in bluntly, the 2 greatest drivers of the stock market are actually Greed (Optimism) and Fear (Pessimism).

The Real Price of a Property
To give an illustration of what is Behavioral Finance, imagine you are looking to buy a house in a prime area for your own residential use. You checked out the price of recent transactions for nearby units and also heard from your property agent that price is going for $1000 per square feet (psf). Having this price level in mind, you started searching for a unit that fits your preference. Being highly efficient, your agent immediately found 1 that matches all your requirements. Near a bus and MRT interchange that also have an integrated mall, within 1km of a prestigious school, have amenities like a swimming pool, gym and function room, age of the house is less than 10 years and the unit is very well maintained with friendly neighbors.

The asking price of the owner is $1100 psf, slightly higher than the price you have in mind. So you hesitated and wanted to look around, believing that there must be some other units that fit the price you are willing to pay. But who knew that the property market started to boom and houses within the area started changing hands for as high as $1300 psf. You ran with your tail between your legs to the owner, begging him to sell for the original asking price of $1100. Knowing the market as well as you, the owner is now asking for the median price of $1300.

For fear that the price would go up again, you grudgingly accepted the price and bought the house. However, the property market started becoming a bubble due to the momentum of ever rising prices. When the government raised the interest rates to rein in the bubble, for months property transactions dropped to a miserable level. The same unit within your area is now asking for $800 psf and there were many distressed sale due to the inability to service mortgages in the high interest environment.

Let's look at some facts here, the fundamentals of the house that you bought had not changed much, the integrated interchange is still there, school is still within 1km vicinity, the amenities are still available, and the house is likely to be still less than 10 years old. The only things that could have changed were perhaps the neighbors. Nonetheless, why was it that you had initially only been willing to pay $1000 psf for it, only to accept $1300 psf a few months later? And if you were desperately in need to sell the house due to mortgage issues, you would probably accept the price of $800 psf.

Nothing has inherently changed for house to warrant such price differences in the short time span.

The above illustration is an example of what is happening on the stock market daily. The price that we are willing to pay for an asset changes not because of the changes in the asset's fundamentals, but because of the 1001 behavioral traits that we exhibit as human beings.

The Guru
Recently, I finished reading the book <Behavioral Finance - Insights into Irrantional Minds and Markets> by James Montier. James is a proponent of Behavioral Finance, a value investor, and member of the asset allocation team of Boston-based GMO. In this book, James laid out the various phenomenons of stock market that defied the EMH and showed high correlation to human behavioral traits.

In this post, I shall be condensing a list of market phenomenons from the book for my own reference on the general directions that a company's stock price would take after certain event has happened. This should not be used as an absolute indicator.

Human Bias

  • Over-Optimism
    - Illusion of Control: Feeling that randomness can be controlled
    - Self-Attribution Bias: Success attributed to Skills and Failure attributed to Bad Luck
  • Over-Confidence
    - Men tend to be more over-confident than females: results in more excessive trading that translates into losses
  • Cognitive Dissonance
    - Self-Denial: mental state of rejection to reduce or avoid mental inconsistencies
  • Confirmation Bias
    - Finding and only accepting information that validates current belief or assumption
  • Conservatism Bias
    - Clinging to an established position: difficulty in accepting that the Earth is round after believing it to be flat for years
    • Stock market tends to under-react to fundamental information like dividend omission, initiation or earning reports
    • Stocks with earning surprises outperforms the market by 2%
  • Availability Bias
    - Assessing the probability of an event by the ease with which instances or occurrence can be brought to mind
    • Selecting stocks based on influence of media or broker research
    • Stocks with high media coverage under performs in the next 2 years
  • Ambiguity Aversion
    - Fear of the unknown
    • 70 - 90% of total equity investments remain at home country where one is most familiar
    • Fund managers are consistently more optimistic about their home markets than foreign market
  • Narrow Framing
    - The way in which you frame the question is pivotal to the answer
    • Investors and analysts have allowed themselves to focus on earnings that the corporates have wanted to report rather than earnings they are forced to report
    • Pro-forma earnings (1) > US GAAP (0.47)
  • Prospect Theory
    - How decisions are actually made
    • Loss aversion: Even market pros sell their winners too soon and ride their losers too far
  • Dynamic Prospect Theory
    - Risk perceptions change dependent on prior returns
    • Investors are willing to expect less returns for accepting risk in a good market
Barriers to an Efficient Market
  • Index Funds can drive stock demand/supply to irrational levels
    • Inclusion or removal of stock from an Index forces index funds to perform trades to maintain its composition
    • Stock purchases increases demand and pushes price up, while massive sell off from the funds drives prices down even without any changes in the fundamentals of the stocks
    • Price differences between 2 almost identical assets can be far wider than the transaction costs involved 
      • Twin Securities / Dual Listed Equities showing illogical divergence in prices
  • Market sentiments matter more than fundamental price for equities
    • Price divergence between original company and the aggregate of split company when earnings are essentially the same but belong to different industry in nature
      • Equity Carve Outs / Partial Spin-Off / Split Off IPO
      • Companies with names associated with the Internet during the dot com boom experience higher valuation despite little correlation with the Internet business
      • Companies with stock codes similar to a market superstar being mistaken for the incumbent can experience spike in prices for no reason
  • Arbitrage is Not Risk Free Profit
    • Fundamental Risk: Arbitrageur may be wrong about the position
    • Financing / Noise Trader Risk: Uncertainty over resale value of assets due to irrationality 
      • Horizon Risk: Unknown period for prices to converge
      • Margin Risk: Forced reduction of position due to margin calls
      • Short Covering Risk: Availability of free-float affects ability to short a position
    • Principal - Agent Problems
      • Difficulty for principal in identifying good arbitrageurs results in capital constraint
      • Principal pulling funds from agent when positions temporarily turned sour, right before the arbitrage is profitable
      • Agents lack diversification due to specialization and risk aversion
  • Force of Noise Traders 
    • Trades based on anything but fundamentals
      • Positive Feedback Trading used by noise traders seeks to buy stocks after it has went up and sells after it goes down exhibits trend chasing behavior
      • Overpriced stocks are pushed higher, vice versa for panic selling when price falls   
      • Disrupts profitability of arbitrage, perpetuating the survival of their trading methodology, no matter how unorthodox
    • By rationally exploiting irrational behavior, George Soros' strategy of buying with expectation that other poorly informed investors would continue to enter the market paid off more handsomely than shorting and waiting for correction
Drivers of Various Investing Styles 
  • Investing Styles
    • Small Cap vs Large Cap
    • Index Tracker vs Active 
    • Value vs Growth 
    • Stocks vs Bonds
  • Herd Movements
    • Fundamentalists identifies a style that outperforms other competing styles and move money based on the drivers of the style
    • Switchers observe the price effect of the flow created by best performing styles in recent past and jumps on the bandwagon
    • A wide following soon follows, which propagated the rise of more funds adopting the style
    • Style matures when it is firmly embedded in investor's psyche
    • Decay sets in as bad news on prevalent style is released and/or good news on fundamental of competing style is becoming popular
    • The cycle repeats with switchers jumping bandwagon
  • Styles Rotation
    • Movement of the herd causes unbalanced price level of stocks among stocks that fall within and without the prevalent style as a result of fund flows.
    • Human bias are the drivers of the momentum life cycle (Over-reaction to unreliable information and Under-reaction to reliable information, Over-confidence and Self-attributing bias generating momentum reversal)
      • Momentum trading (3 - 12 months) works for early stage winners and losers 
      • Contrarian strategies (3 - 5 years) works for late stage winners and losers
    • Use of Quantitative Screens to eliminate bias
      • For Value stocks, search for low price-to-book, low volume, long history of disappointment AND starting to deliver good news
      • For Growth stocks, search for high price-to-book, high volume, long history of exceeding earnings expectations AND starting to deliver disappointing news 
  • Market Signals
    • Dividend Payout Ratio (DPR) 
      • Bottoming of DPR represent strong recent earnings, increase odds of weak future earnings
        • Value outperforms after DPR has bottomed (dropped from a period of high)
      • High DPR represents weak earnings, increase odds of improving economy and earnings outlooks
        • Growth outperforms when DPR troughs (turning up after a period of lows)
    • Initial Public Offering (IPO) / Seasoned Equity Offering (SEO)
      • IPOs tend to outperform on its launch date but under performs over subsequent periods
      • Periods with high amount of IPO signifies that the market is overvalued and possibly running up to a bursting of bubble
    • Mergers and Acquisition (M&A)
      • High number of M&A via stocks implies that stock valuation is overpriced, similar to IPO, clustered activities of M&A signifies an overpriced market
    • Insider Trading
      • Irregular purchases of stocks by insiders generally imply that the stock will outperform in the subsequent period
Intrinsic Value of Stocks
  • Market bubbles are the result of market participants' mindset
    • Most investors exhibit 0 - 3 levels of reasoning whereby even if all of them thinks that a crash is coming, they don't iterate their thinking back to the present. They guess that others will sell a couple of steps before the crash, and plan to sell just before that happens.
    • Speculative Bubbles are more likely to occur when:
      • Significantly more inexperienced traders than experienced traders
      • Greater uncertainty over fundamental value
      • Significant payoff despite a very small chance
      • Ability to buy on margin
      • Difficult to execute short selling
  • The only true valuation measure is Discounted Cash Flow
    • Absolute Valuation > Relative Valuation
    • All relative valuation (e.g. PE/G) are subjected to human bias that aims to make the derived value more attractive.
      • Anchoring is the most deadly bias when using relative valuation
      • Results in Over-confidence and Over-optimism
    • Use Cash flow to avoid Narrow Framing

The checklist goes on but the rest of the concepts covered in the book is beyond my comprehension at the moment, so I shall not pretend that I understood them. Nonetheless, what I have condensed shall serve as my warning beacon while I tread the perilous journey of investing.

Conclusion
Investing in the stock market is more than knowing the fundamentals and being right all the time. Sometimes, knowing why things don't go the way they are supposed to, helps you to exploit the inefficiencies of the market and make profits out of those who are irrational. By keeping my own human bias in check, I shall keep my ears tuned to the market signals that spells opportunity. Equipped with tools that I have collected, faith in my chosen style, patience with my execution and courage to brave temporary set backs, I shall work hard and progress towards my desired end.


Thank you for reading. If you have any comments or feed backs, please post them in the comment section below or drop me an email at ohhanwee@gmail.com.


Disclaimer
I do not own any of the images used in this article.
This publication is for general reading only. The information and materials contained on this web site are subject to change without notice, are provided for general information only and should not be used as a basis for making investment decisions. It does not form part of any offer or recommendation, or have any regard to the investment objectives, financial situation or needs of any specific person. Before committing to an investment, please seek advice from a financial or other professional adviser regarding the suitability of the product for you and read the relevant product offer documents. I am not liability and will not be liable for any loss or damage arising directly or indirectly (including special, incidental or consequential loss or damage) from your use of this web site, howsoever arising, including any loss, damage or expense arising from, but not limited to, any defect, error, imperfection, fault, omission, mistake or inaccuracy with this web site, its contents or associated services, or due to any unavailability of the web site or any part thereof or any contents or associated services.

Thursday 4 June 2015

Detecting Earnings Manipulation in Financial Statements

To a retail investor like myself who rely mainly on a company's annual report for assessing whether it is investable, ensuring that the numbers in the report are true reflections of the company is extremely important.

Other than believing in the regulatory bodies of the financial world, it is theoretically possible to identify dishonesty by analysing the numbers within the annual reports itself.

By cross referencing various financial ratios, and running these ratios through models designed to detect fraud, we would be able to screen for suspicious companies to be eliminated from our "Universe of Stocks" for analysis.

IMPLICATIONS
Earnings manipulation can mislead investors into investing in companies that are not as good as presented, or it could delay investors from exiting a declining company by smoothing earnings. The scary truth is that such unethical acts could actually be done legally by exploiting accounting loopholes.

Not only does fraudulent financial reporting causes huge financial losses to investors, it disrupts productive capital allocation, diminishes investor confidence in capital market, and increases the need for costly regulations to be imposed.

One of the most common earning manipulation is the use of Accruals to boost revenue. In an oversimplified example: a company may book an extraordinary order before the closing of its books with a customer who is in cahoot with its schemes. This booked order would boosts revenue and reported earnings.

But after the books are closed, the customer could either cancel the order or fail to pay up, causing the company to write-off the receivables. The same trick on a bigger magnitude could be pulled in the coming financial reporting period so that revenue is smoothed. Investors who are not trained to detect such dishonesty would pay a high price for the illusive earnings.

Eventually, the antics can never make up for the truly poor performance of the company and stock prices will suffer due to earnings decline or revelation of fraud.

EARNINGS MANIPULATION DETECTING MODELS
Through my readings, I have managed to identify 3 models that are designed to detect earning manipulation. They are Richard Sloan's Scaled Total Accruals (STA), Hirshleifer et al's Scaled Net Operating Assets (SNOA), and Benish's M-Score (PROBM Model).

STA identifies the current flow of accruals. The greater the scaled total accrual, the more likely earnings are being manipulated.

SNOA captures the growth of accruals over time, the higher the net operating assets, the lower the stock returns.

Both STA and SNOA are actually accrual based earning manipulation detectors. They utilize relatively simple formula that scales Accrual against total assets as a gauge for earnings manipulation.

However, the predictive ability of both STA and SNOA have diminished over the years, probably due its wide adoption and simplicity that resulted in the ease of companies side-stepping it. Hence, I shall not go in-depth for these 2 models.

WHAT IS BENISH M-SCORE?

Benish M-Score is a mathematical model that aims to determine if a company has manipulated its earnings in its annual report. The model uses financial ratios calculated using the company's financial statements to describe the degree to which the earnings have been manipulated. The M-Score is published by Professor Messod Beneish from Indiana University in the paper: The Predictable Cost of Earnings Manipulation.

The paper stipulated that firms with a high probability of overstated earnings have lower future earnings, less persistent income increasing accruals, and lower future returns. In order to identify such companies, the M-Score uses 8 variables and a mathematical formula to derive a score.

The 8 variables are as follows:

Financial Statement distortion
DSRI = days' sales in receivables index (ratio of days' sales in receivables in year t to year t − 1)
AQI = asset quality index (ratio of noncurrent assets other than plant, property and equipment to total assets)
DEPI = depreciation index (ratio of the rate of depreciation in year t – 1 to the corresponding rate in year t)
TATA = total accruals to total assets (change in working capital accounts other than cash less depreciation)

Predisposition to engage in earnings manipulation
GMI = gross margin index ( ratio of gross margin in year t − 1 to gross margin in year t)
SGI = sales growth index (ratio of sales in year t to sales in year t − 1)
SGAI = sales, general and administrative expenses index (ratio of SGA expenses in year t relative to year t − 1)
LVGI = leverage index (ratio of total debt to total assets in year t relative to year t − 1)

After obtaining the value of the 8 variables, they are substituted into the following formula:
PROBM = −4.84 + 0.92 × DSRI + 0.528 × GMI + 0.4.404 × AQI + 0.892 × SGI + 0.115 × DEPI −0.172 × SGAI + 4.679 × TATA − 0.327 × LVGI

As a general guide, a PROBM of more than -1.78 indicates possibility of earnings manipulation.

From the book Quantitative Value which I have introduced in this post, I found a breakdown of the range for individual variables to distinguish between manipulators and non-manipulators:

Mean Index
(Nonmanipulators)
Mean Index
(Manipulators)
DSRI 1.031 1.465
AQI 1.039 1.254
DEPI 1.001 1.077
TATA 0.018 0.031
GMI 1.014 1.193
SGI 1.134 1.607
SGAI 1.054 1.041
LVGI 1.037 1.111

Although the model is not 100% accurate, and do mistakenly flags innocent companies as manipulators, it still has a 64% rate of identifying fraudulent companies. This rate is pretty decent and I would not take my chances, even if it means removing some companies that might actually be good. Better safe than sorry right?

For those who are not willing to calculate the M-Score, you can actually subscribe to Gurufocus' screener where it does the heavy lifting for you.

CONCLUSION
Earnings Manipulation will affects my portfolio's overall performance and may result in irrecoverable losses. Besides relying on regulators to ensure that companies are honest in their reporting, I can use financial models developed by really smart people to screen away suspicious companies. By doing so, I would have a wider margin of safety and at the same time save my resources from being wasted on unethical companies. If a company scores more than -1.78 for its Benish M-Score, those companies would be eliminated from my "Universe of Stocks" that I analyse for my portfolio construction.


Thank you for reading. If you have any comments or feed backs, please post them in the comment section below or drop me an email at ohhanwee@gmail.com.


Disclaimer
This publication is for general reading only. The information and materials contained on this web site are subject to change without notice, are provided for general information only and should not be used as a basis for making investment decisions. It does not form part of any offer or recommendation, or have any regard to the investment objectives, financial situation or needs of any specific person. Before committing to an investment, please seek advice from a financial or other professional adviser regarding the suitability of the product for you and read the relevant product offer documents. I am not liability and will not be liable for any loss or damage arising directly or indirectly (including special, incidental or consequential loss or damage) from your use of this web site, howsoever arising, including any loss, damage or expense arising from, but not limited to, any defect, error, imperfection, fault, omission, mistake or inaccuracy with this web site, its contents or associated services, or due to any unavailability of the web site or any part thereof or any contents or associated services.

Wednesday 27 May 2015

Letting Programs and Formulas Manage Your Investment Portfolio

Imagine a computer that can tell you which company's share to buy and when to buy them, and at the end of a 5 year period, you can most certainly outperform a benchmark Index such as the S&P500 by a margin of 2 - 3 %, which is a significant difference over 17 years.

This is a new concept and investment idea that I have gotten interested in, after listening to the advice of a successful fund manager who was kind enough to guide me. This kind soul is none other than Mr William Cai, one of the speakers from the ETF forum that I attended in April this year.

2 of the books that he recommended, which I will in turn recommend to you are called <The Little Book That Beats The Market> by Joe Greenblatt and <Quantitative Value> by Wesley R. Grey PhD and Tobias E. Carlisle.


To summarise the contents of the books, it is basically the proof that by following a set of relatively simple formula strictly, one can consistently generate high returns of more than 15% per annum over a minimum investment period of 3 to 5 years. The books went to great lengths to validate their methodology and conducted extensive back-testing using high quality data of up to 17 years and are free of various biases such as survivor-ship bias and look-ahead bias.

Survivor-ship bias is the use of data that excludes companies that are no longer around today. This bias dilutes the test results by not looking at companies that are doomed to fail, information that is not available in real life application. Look-ahead bias is the use of point-in-time data that are usually not available at the stated period as it takes a few months before annual reports are audited and released. Such data are "in the future" and not possible for real life execution.

The concept is to first eliminate all poor quality stocks from the universe of stocks that I am looking at. Poor quality refers to the possibility of going bankrupt as well as the tell tale signs that the company is faking its financial results. Next, I will rank all stocks separately against 2 measurements: Quality and Price. Based on the 2 measurements, I will re-rank them according to their aggregate score to find the top 1% of stocks that are relatively the cheapest and of highest quality.

Being all pumped up, I am ready to put this concept to the test. With my knowledge of using advanced Excel formula and newly acquired Excel skills such as web scrapping and integrating Excel with Access database, I am very well aware of what I need to do to conduct my own tests. But I am faced with 1 major road block, and that is the source of data for my testing.

Garbage in, garbage out. So to avoid having useless results that could fatally mislead my test, securing reliable data is extremely important. However, as you might expect, quality stuff do not come free. One of the data source that the books recommended, Compustat's point-in-time data, is the database that I would really like to get my hands on. But I have no idea how to obtain it. If you happen to have access to this database, kindly let me know and allow me to use the data. I would be in your debts.

Regardless, I have managed to find a source of 10 year financial statement data which I am able to scrap for free. I shall use this source to build my financial model and run some preliminary tests on the concepts described in the books. Once the system is built, it would only take the plugging in of quality data for me to achieve the end result I want.

So here's my plan:

After building the system and running as much tests as I possibly could, if the results are as the books describes, I intend to raise funds of SGD100K to try out the investment strategy. The portfolio shall consist of up to 10 stocks with equal weightage. I will strictly follow the instructions churned out by my system for 5 years, with the portfolio being re-balanced every 12 months.

One of the biggest obstacle that an average person faced when trying to accumulate wealth is the very regulations that is put in place to protect them. Many investment funds can only serve accredited investors, people who are either earning SGD300K a year or have assets worth SGD2mil. This makes the rich richer while the poor have to struggle to find good returns on their money.

Hence, with the up and coming trend of crowdfunding platform and the roundabout regulations on securing funding from others, I believe that an average person should be allowed to invest in such high return projects.

While there are definitely some risks involved in this investment, the margin of safety is relatively wider as compared to picking stocks individually. Nonetheless, to assess if you should even consider investing, here's a basic checklist that I have created.

For a minimum investment of SGD10,000:
1) Are you taking home less than SGD3K a month?
2) Are you saving less than SGD500 a month?
3) Does SGD10K make up more than 50% of your total cash and cash equivalent assets?
4) Is the total debt that you currently owe (mortgage, car loan, school loan etc) more than your 4 year income?
5) Is the monthly repayment on your debt more than 50% of your take home salary?

If your answer to any of the above 5 question is "Yes", I am sorry to say that you should not consider investing in such strategy and should opt for safer options such as the new Singapore Saving Bond that is stipulated to launch in mid June 2015.

As a disclaimer, I am not authorised to managed funds as I do not have the proper license. But if you trust me and would like to find out more about this strategy, feel free to get in touch with me at my email ohhanwee@gmail.com

Thank you for reading. If you have any comments or feed backs, please post them in the comment section below.


Disclaimer
This publication is for general reading only. The information and materials contained on this web site are subject to change without notice, are provided for general information only and should not be used as a basis for making investment decisions. It does not form part of any offer or recommendation, or have any regard to the investment objectives, financial situation or needs of any specific person. Before committing to an investment, please seek advice from a financial or other professional adviser regarding the suitability of the product for you and read the relevant product offer documents. I am not liability and will not be liable for any loss or damage arising directly or indirectly (including special, incidental or consequential loss or damage) from your use of this web site, howsoever arising, including any loss, damage or expense arising from, but not limited to, any defect, error, imperfection, fault, omission, mistake or inaccuracy with this web site, its contents or associated services, or due to any unavailability of the web site or any part thereof or any contents or associated services.