The information presented in this article has expired its validity as we wait for the reporting of FY2014's results.

Business Overview
YangZiJiang ShipBuilding Holdings Ltd (YZJ) is one of China’s leading shipbuilders offering integrated marine and offshore services, which are complemented and enhanced by diversified interests in financial investments and property development. The group produces a broad range of commercial vessels–containerships, bulk carriers, multi-purpose cargo vessels and offshore engineering projects. It has 5 main business segments, namely: Shipbuilding and Offshore; Financial Investments; Shipping logistics and chartering; Ship demolition & Steel fabrication (incl. Non-marine Related) and related Trading businesses; as well as Property Development. Under its umbrella, YZJ has 65 subsidiaries (51-100% equity holdings) and 5 associate companies (21-50% equity holdings) according to its 2013 Annual Report. The number is expected to change as the shipbuilding industry consolidates and YZJ expands its balance sheets.

The Group achieved a revenue of RMB14.3 billion in FY2013, down 3.1% year-on-year. Revenue from shipbuilding and its related activities was RMB12.8 billion, down 4.9% year-on-year, forming 89.5% of revenue generation. Of this amount, ship demolition works contributed revenue of RMB353 million, and other shipbuilding relevance amounted to RMB828 million. Revenue from Financial Investments (held-to-maturity assets and micro-financing) grew 14.9% to reach RMB1.5 billion. There was no breakdown of revenue generated by the Property Development in the Chairman’s statement, probably because it is a new segment that has not posted any revenue generation or it could be suffering losses due to China's gloomy property sector outlook.
However, it is noteworthy of how YZJ has justified its expansion into property development when they are shipbuilders by nature. The reasons was because of the Group's ability to acquire land at much better rates due to the location of their old yards near coastal areas, their positions as a top tax contributor allowing them to tender for urban redevelopment projects at more favorable conditions, and interestingly, because they would be able to foreclose properties and land use rights that their financial investments customers has put up as collateral. Collateral are valued at a fraction of the borrower’s land acquisition price. Profiting from the increasing trend of defaults seems like a smart move. Although in the short term, this might set back the Group's profit due to higher default rates, as long as the group has the financial muscle to pull through the property downturn, the discounted landbanks would payoff handsomely in future.
Nonetheless, our main focus when analysing YZJ should still be its ship building business. YZJ made it into Beijing's "white list" of shipbuilders, which is a list of 51 environmentally friendly and efficient yards that entitles companies on this list to favourable government policies such as tax rebates and cheaper financing. This is significant in the sense that it can be viewed as a consolidation of the industry in China, and those yards that did not make it into the list would eventually be eliminated from the competition pool. As I am not well versed in the ship building industry, it is not within my circle of competence to pass judgement or make predictions on the future of this industry. Being a mid-cap public company of SGD4.7 billion, YZJ is not short of analyst followings. Many reviews and analysis can be easily found on the web on the shipbuilding industry and on YZJ's outlook.
Management Overview
Executive Chairman, Mr Ren Yuanlin's statement in 2013 provided very clear directions that the group is heading. Being the founder, owner (deemed interest of 26%), as well as the executive chairman gives assurance that he will be aligned with shareholders in ensuring the long term sustainability of the business. Additionally, with bonus forming the bulk of his remuneration (77%) speaks volume about the motivation for him to drive the group towards a brighter future.
What is noteworthy is that the group was able to predict a downturn in the ship building segment and aptly diversify into other segments to prevent the decline in revenue. This demonstrated foresight and experience in what they do. Mr Ren was candid enough to explain the rationale for expanding into businesses that the group is entering as well as stating clearly the benefits that each segment and component of business will bring to the group. As an outsider to the ship building business, I was able to learn much from what he has said and I like it very much.
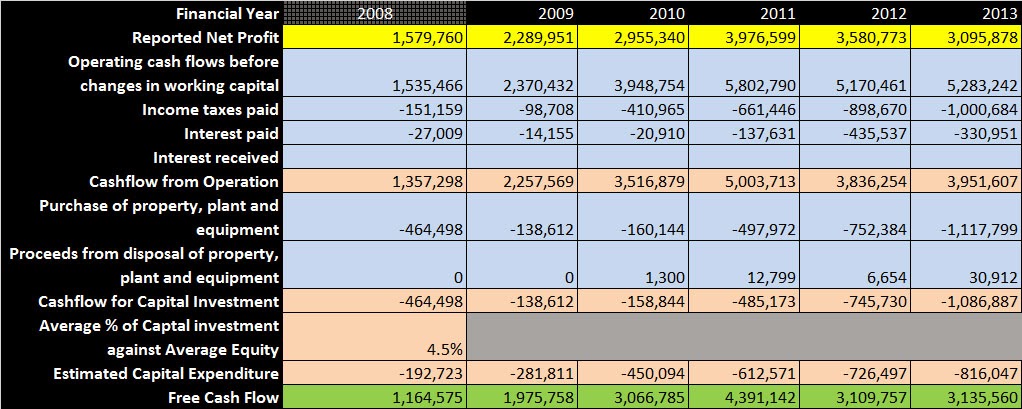
All calculation uses FCF as the real profit instead of relying on reported net profit. Deviations of FCF from reported profit was less than 50%, signifying that earnings reported has minimal accounting gimmicks.
FCF is derived from the cash flow statement: [Operating Cash Flows before Changes in Working Capital] (ignoring changes in working capital), factoring all tax and interest expenses, and deducting an estimated capital expenditure (CapEx). CapEx is used in place of [Depreciation and Amortization] because it is a closer estimate of what the company really needs to maintain itself.
I have derived CapEx by taking the 5 year average of [Purchase of property, plant and equipment] adding back [Proceeds from disposal of property, plant and equipment], and obtaining a percentage figure against a 5 year average of [Equity]. So CapEx per year is obtained by taking this percentage figure and multiplying by that year's equity. This sum is then deducted from the Operating Cash Flow for that year's FCF.


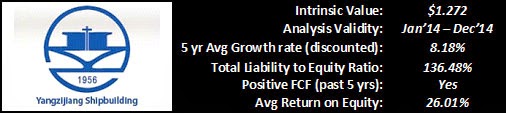
YZJ has achieved a discounted 5 year average growth rate of 8.18%, my benchmark is >5% based on an estimate of Singapore's average economic growth. As companies cannot be expected to grow at high growth rates forever, the average economic growth of Singapore should be the benchmark of this criterion for all companies operating in Singapore. As long as the company is growing more than Singapore's economic growth, it should be doing well (figures obtained from http://www.tradingeconomics.com/singapore/gdp-growth).


The intrinsic value of TTJ of SGD1.272 is calculated using a modified FCF Discounted Model. I have made some modifications to the academic formula to increase the accuracy of my final figures. This figure has to be taken with a pinch of salt as one of my filtering criteria was not satisfied. As I have yet to determine the discount rate to account for the increased risk (I don't subscribe to CAPM and beta), I did not factor in the increase in risk of default due to the high leverage ratio which should have resulted in a lower intrinsic value.
The [Average rate of change] was introduced to form a bridge between the growth rate of FY0 to FY1. This rate will modify the projected future growth rate of this company based on historical changes in growth rate. If growth rate has been consistent, this bridging discount will be minimal, but if growth rate has been inconsistent, this bridging discount will reflect the possible fluctuation of FY1's growth. This bridging discount is calculated by taking the average of the discounted rate of change. The discounted rate of change is simply the difference from the first FY and the next.

Rather than using 15% ROE as the discount rate to find present value of the future FCF, I've factored in a conservative inflation rate of 3.12% to be my discount factor. Since I'm expecting to double my money in 5 years, the rate of return that will deliver that expectation after factoring inflation is 18.45%. So that's my discount rate to find present value of future cash flows. Inflation rate for Singapore is obtained from http://www.tradingeconomics.com/singapore/inflation-cpi
Margin of safety is only 5.5%, (1.272/1.205 - 1 = 5.5%), while my benchmark is >20%. There is no significant discount in price to offer a buffer, in case of error in estimation. I would not recommend the purchase of this company stocks.
Thank you for reading. If you have any comments or feed backs, please post them in the comment section below. If you would like to check out my analysis of other companies, feel free to go to this page: http://fundamentally-invest.blogspot.sg/p/blog-page.html
Disclaimer
This publication is for general reading only. The information and materials contained on this web site are subject to change without notice, are provided for general information only and should not be used as a basis for making investment decisions. It does not form part of any offer or recommendation, or have any regard to the investment objectives, financial situation or needs of any specific person. Before committing to an investment, please seek advice from a financial or other professional adviser regarding the suitability of the product for you and read the relevant product offer documents. I am not liability and will not be liable for any loss or damage arising directly or indirectly (including special, incidental or consequential loss or damage) from your use of this web site, howsoever arising, including any loss, damage or expense arising from, but not limited to, any defect, error, imperfection, fault, omission, mistake or inaccuracy with this web site, its contents or associated services, or due to any unavailability of the web site or any part thereof or any contents or associated services.
But I have to add that from the information gleaned Chairman's message alone, it is very difficult to determine if the decision making of the board is resistant to industrial imperatives. The best way to judge management is actually to be employed in the company and working directly with the management team. This aspect is highly subjective and is prone to perspective bias. Therefore, personally I don't have the experience nor qualification to judge and would just go along with my gut feelings, supported by the numbers in the annual reports.
Financial Overview
This company has scored 3 out of 4 for my 4 criteria filter (the criteria are listed on the top right hand corner of this post). It is calculated to be trading slightly below its intrinsic value, calculated using adjusted Free Cash Flow (FCF) discount model. As a word of caution, historical record of China company's financial reporting is laden with many incidents of fraud, therefore extra care needs to be exercised when buying China Companies.

All calculation uses FCF as the real profit instead of relying on reported net profit. Deviations of FCF from reported profit was less than 50%, signifying that earnings reported has minimal accounting gimmicks.
FCF is derived from the cash flow statement: [Operating Cash Flows before Changes in Working Capital] (ignoring changes in working capital), factoring all tax and interest expenses, and deducting an estimated capital expenditure (CapEx). CapEx is used in place of [Depreciation and Amortization] because it is a closer estimate of what the company really needs to maintain itself.
I have derived CapEx by taking the 5 year average of [Purchase of property, plant and equipment] adding back [Proceeds from disposal of property, plant and equipment], and obtaining a percentage figure against a 5 year average of [Equity]. So CapEx per year is obtained by taking this percentage figure and multiplying by that year's equity. This sum is then deducted from the Operating Cash Flow for that year's FCF.

5 yr Avg Growth Rate/Avg ROE

YZJ has achieved a discounted 5 year average growth rate of 8.18%, my benchmark is >5% based on an estimate of Singapore's average economic growth. As companies cannot be expected to grow at high growth rates forever, the average economic growth of Singapore should be the benchmark of this criterion for all companies operating in Singapore. As long as the company is growing more than Singapore's economic growth, it should be doing well (figures obtained from http://www.tradingeconomics.com/singapore/gdp-growth).
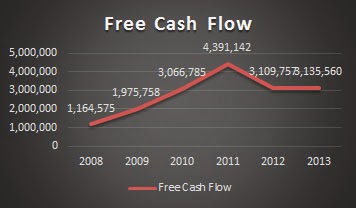
The discount is based on a decay factor to consider the effect of time on accuracy, so that older performance would have lesser weight on future performances. For example, growth rate in 2013 is multiplied by a decay factor of 83%, 2012 is multiplied by 80% so on and so forth. The final sum is averaged to obtain the growth estimate of 8.18%. This is inline with the declining trend of Growth rate over the past 3 years.

Its 5 year average return on equity (ROE) is 26.01% based on FCF, my benchmark is >15% to factor for a investment strategy that expects a doubling of capital in 5 years.
Total Liability to Equity Ratio

However, the criteria that failed to meet the mark was the leverage ratio. Total Liability is 136.48% of Equity, quite a high leverage ratio for my appetite. High leverage ratios increases a risk of default which translates in to the possibility of losing any invested capital. Although its interest coverage ratio was more than 10 (Earnings before interest and tax divided by interest expense: 4,761,895/ 330,951 = 14.39, ideal ratio is 1.5 times or more), I am still not comfortable with the balance sheet.
This could be attributed to the manner at which assets are valued or the classification of debt expenses that might be far from reality. Bank borrowings swelled from RMB3.3 billion in 2012 to RMB12.2 billion in 2013, factoring for the jump in Total liability. Interest expense would be significantly different in 2014. Considering the uncertainty in current global interest rate climate, a highly leveraged company is extremely vulnerable to rising interest rates.
Intrinsic Value


The intrinsic value of TTJ of SGD1.272 is calculated using a modified FCF Discounted Model. I have made some modifications to the academic formula to increase the accuracy of my final figures. This figure has to be taken with a pinch of salt as one of my filtering criteria was not satisfied. As I have yet to determine the discount rate to account for the increased risk (I don't subscribe to CAPM and beta), I did not factor in the increase in risk of default due to the high leverage ratio which should have resulted in a lower intrinsic value.
The [Average rate of change] was introduced to form a bridge between the growth rate of FY0 to FY1. This rate will modify the projected future growth rate of this company based on historical changes in growth rate. If growth rate has been consistent, this bridging discount will be minimal, but if growth rate has been inconsistent, this bridging discount will reflect the possible fluctuation of FY1's growth. This bridging discount is calculated by taking the average of the discounted rate of change. The discounted rate of change is simply the difference from the first FY and the next.

Rather than using 15% ROE as the discount rate to find present value of the future FCF, I've factored in a conservative inflation rate of 3.12% to be my discount factor. Since I'm expecting to double my money in 5 years, the rate of return that will deliver that expectation after factoring inflation is 18.45%. So that's my discount rate to find present value of future cash flows. Inflation rate for Singapore is obtained from http://www.tradingeconomics.com/singapore/inflation-cpi
Conclusion
I believe that YZJ will be able to continue performing up to its past performance standards based on its competent management team, the economic climate which it operates and the relationship it has with the China government. Being a mid cap that is well followed, it is my believe that the value of this company will be more or less correctly reflected by the market most of the time. Although the calculated intrinsic value is not attractive to me, if investors are willing to bear the risk of default over high growth and ROE rates, and is willing to hold the stock for more than my 5 year projected investment period, this investment might still be profitable.
Thank you for reading. If you have any comments or feed backs, please post them in the comment section below. If you would like to check out my analysis of other companies, feel free to go to this page: http://fundamentally-invest.blogspot.sg/p/blog-page.html
Disclaimer
This publication is for general reading only. The information and materials contained on this web site are subject to change without notice, are provided for general information only and should not be used as a basis for making investment decisions. It does not form part of any offer or recommendation, or have any regard to the investment objectives, financial situation or needs of any specific person. Before committing to an investment, please seek advice from a financial or other professional adviser regarding the suitability of the product for you and read the relevant product offer documents. I am not liability and will not be liable for any loss or damage arising directly or indirectly (including special, incidental or consequential loss or damage) from your use of this web site, howsoever arising, including any loss, damage or expense arising from, but not limited to, any defect, error, imperfection, fault, omission, mistake or inaccuracy with this web site, its contents or associated services, or due to any unavailability of the web site or any part thereof or any contents or associated services.
No comments:
Post a Comment