Price to Buy: S$0.107 [Overvalued]
Valuation Valid until release of 31 December 2016 Annual Report
COMPANY OVERVIEW

VALUATION
Although past results does not necessarily equal to future performances, when there is a track record, the chances of similar results happening in future is higher. The concept is to project specific line drivers in the balance sheet, income statement, and cash flow statement and model the respective changes to the bottom line.
For margin of safety, a very high discount rate of 18.45% is used when discounting cash flows. The discount rate is the expected return for doubling an investment in 5 years, adjusted for an inflation of 3% each year. The final calculated intrinsic value is further discounted by another 20%.
This valuation method is applied unilaterally to all the companies in my screener and the predictions are best applicable for companies with strong Profitability, Financial health and Sustainability which translates into consistency. Consistency is the key ingredient for more accurate predictions and higher probability of derived value being right.
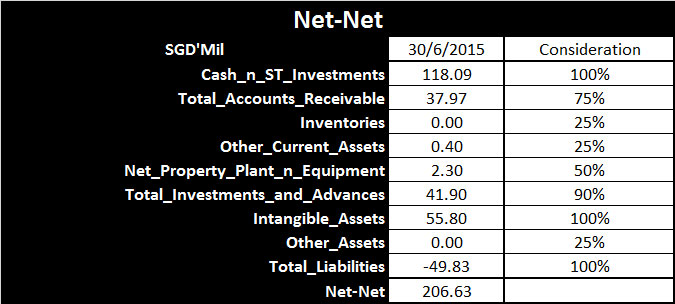
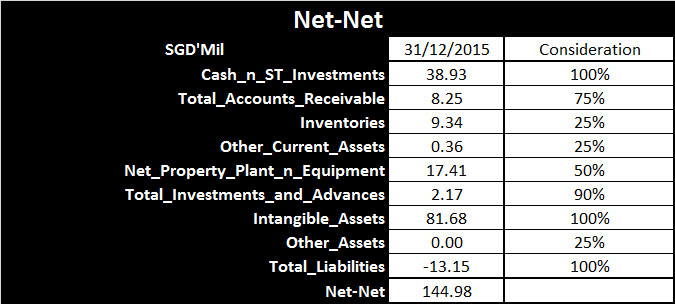
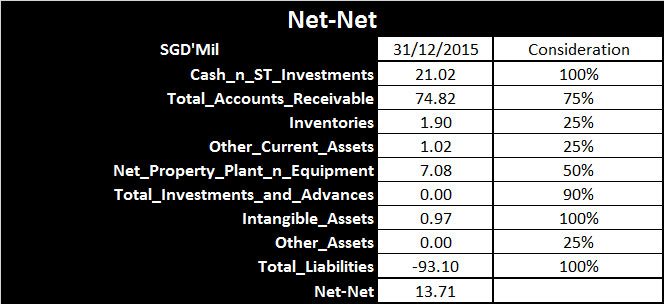
Net-net per share is derived by discounting each category of balance sheet items according to liquidation value estimates. The final sum of all items is divided by the total number of shares to derive a price of S$0.038 per share. This is the price each equity shareholder is entitled to if the company is forced to liquidate, after repaying all its debt and liabilities.
NeraTel is valued at an intrinsic value of S$0.133. With a margin of safety of 20%, the price to buy is anything less than S$0.107. At the current price of S$0.545, NeraTel is deemed as overvalued to me because it is not able to deliver my expected returns.
For further understanding of the thoughts behind the valuation, please check out this article on how should stock investments be valued.
PROFITABILITY
A variety of financial ratios were used to construct the above profitability indicators with the purpose of simplifying analysis of financial statement data. The fresh green indicators denotes that the benchmark is exceeded while yellowing-green to red denotes the degree of the indicator falling below benchmark.

The above histogram shows the simple profitability measurement of various components in the income statement. Revenue (blue) and profit margin (yellow) has sort of plateaued for the past 3 years, indicating that NeraTel may have very limited growth opportunities. Cost of goods sold (COGS - orange) is the variable cost that increases as revenue increase has shown to be consistent throughout the years. Sales & General Administrative Expenses (SG&A - grey) are the fixed cost of running the business regardless of revenue has also been kept at the same level. Profit Margin has been consistently below 15% for the past 5 years, which indicates that this company does not really have very strong pricing power.

Positive free-cash-flow (FCF) indicates that the company is able to generate enough cash to fund its capital expenditures and investments with enough leftover for shareholders. As seen from the above histogram, although NeraTel has been able to generate positive FCF for the past 5 years, there is a very obvious downtrend oweing to a decline in net operating cash flow.
FINANCIAL HEALTH

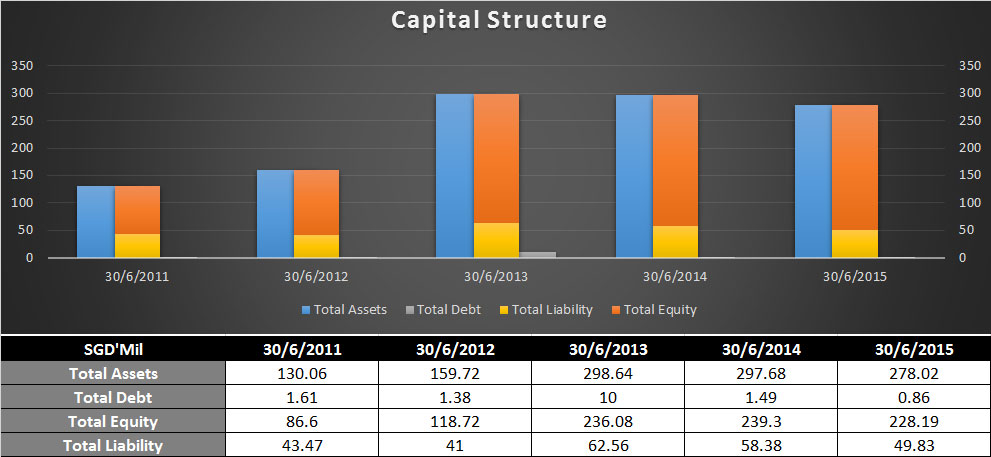
The above histogram shows the capital structure of the company over the past 5 years. It is important to note that liabilities are not the same as debt, but debt is definitely a part of liability. The more equity (orange) you see, the better, because equity is what you own as a shareholder. The lesser the debt (grey), means that the company is less likely to declare bankrupt because only companies that are unable to repay their debt will be forced to declare bankrupt.
NeraTel has increased its debt from $S4.7mil in FY2014 to S$16.3mil FY2015 and its equity has declined from a high of S$66mil in FY2013 to S$56mil in FY2015. Total Liabilities have increased steadily over the years which is a sign that the balance sheet is becoming heavier.
SUSTAINABILITY
NeraTel has a margin stability of 5.9 and margin growth of 9.9%, indicating that its profit margin has been quite stable and there is some margin growth over the years.

The above histogram gives us an indication of whether there is a sudden change in the operations of the company by exhibiting the trends of each of the components in the working capital. Generally, we would like to see more receivables (yellow) than payables (orange) which indicates that the company is expecting to collect more money than it is expect to pay up. However, too much receivables may indicate that the company might be having trouble collecting its dues. Other current liabilities (peach) may include items such as Accruals, Unearned Revenue, PP&E Vendor, Deferred Income, Deposits from Customers, Mark-to-Market Instrument etc.
Working capital for NeraTel has been pretty consistent for the past 5 years.

To find out whether the company is having issues collecting the money that its customers owe, we can use the Account receivable days (yellow) over the years to inform us of the trend. An uptrend is a bad sign that more customers are having difficulty paying or that the company is extending looser credit terms.
Both the Account receivable days (yellow) and Accounts payable days (orange) are above the 180 days range which might mean that the company is having slow cash flow. This might be a bad thing in a slow economy.
Inventory days (grey) has remained within 30 days, indicating that NeraTel has very little inventory and they are moving out of the warehouse within a month on average.
SUMMARY
NeraTel has a consistent profit margin, but at a low range of less than 15% for the past 5 years. It has declining but positive FCF for the past 5 FYs and pays dividend twice a year. The company's balance sheet is becoming heavier with more liabilities and debt issuance has increased from FY2014. Overall, NeraTel seemed like a company in decline. Hence, NeraTel is deemed to be overvalued and its recommended purchase price is S$0.107.
Do check out my list of company recommendations for 2016 here.
Official Company Website: http://www.neratel.com.sg/
Company's Dividend History: http://sgxdata.pebbleslab.com/index.asp?m=2&NC=N01
Financial Statement Data Source: https://online.capitalcube.com/#!/stock/sg/singapore/N01/financials
Thank you for reading and please share it as a form of encouragement for my effort. If you have any comments or feed backs, please post them in the comment section below.
Do check out my analysis of other companies: http://fundamentally-invest.blogspot.sg/p/blog-page.html
Disclaimer
This publication is for general reading only. The information and materials contained on this web site are subject to change without notice, are provided for general information only and should not be used as a basis for making investment decisions. It does not form part of any offer or recommendation, or have any regard to the investment objectives, financial situation or needs of any specific person. Before committing to an investment, please seek advice from a financial or other professional adviser regarding the suitability of the product for you and read the relevant product offer documents. I am not liability and will not be liable for any loss or damage arising directly or indirectly (including special, incidental or consequential loss or damage) from your use of this web site, howsoever arising, including any loss, damage or expense arising from, but not limited to, any defect, error, imperfection, fault, omission, mistake or inaccuracy with this web site, its contents or associated services, or due to any unavailability of the web site or any part thereof or any contents or associated services.