Wednesday 27 July 2016

How to Protect Yourself from Investment Scams in Singapore?

The Need for Investments

In a highly developed nation like Singapore, it is not enough to rely on active income alone to retire comfortably, simply because the cost of living here is too high.

Our government actively encourages us to manage our own finances, and even launched safe investment products (SGS Bonds) that non-financial savvy or risk adverse folks can utilise to earn slightly higher interest rates compared to bank saving accounts.

Although we have our Central Provident Fund (CPF), which pays up to 5% interest on our savings, the money is locked away until our state-dictated retirement age.

So for those seeking higher returns, they would need to invest in riskier products such as the stock market, real estate, commodities, derivatives etc. Followers of the market would sigh at the dismal performance of these investment vehicles, which were lackluster for a period of time now.

This gave rise to crowdfunding platforms where high returns were dangled to attract funds. The success stories where funds were oversubscribed multiple times, created a hype and resulted in many people lowering their guards when it comes to protecting their capital from risks.

The general view is that crowdfunding platforms had them covered in terms of default risks, by only selecting those borrowers that are unlikely to default. This is far from the truth and investors should still conduct their own due diligence on the borrowers, regardless of what the crowdfunding platform says. They are ultimately the middlemen who stands to gain from a fully subscribed funding project.

Nevertheless, legitimate channels of crowdfunding, that are genuinely serving as the middlemen between honest business owners and eager investors, is a good evolution of our sophisticated capital market where traditional money lenders can no longer serve all needs.


Avoiding Investment Scams

Amidst the heightened awareness to invest and to plan for our retirement, many has inadvertently fell prey to unscrupulous individuals or organisations who fed upon the ignorance and greed of the masses.

Hence, I would like to share a simple way to identify whether an investment scheme that you have come across is a scam. I have learnt this from someone whom I am fortunate enough to be acquainted with, and who is now my most trusted financial adviser Mr William Cai.

When it comes to the subject of money, there is no such thing as being too careful. True that you might miss out on opportunities because you just wanted to be extra careful, but it beats losing everything you have got, just because you were careless or have no idea what you are doing.

Bear this in mind, in a legitimate investment scheme where someone else will be managing your money on your behalf, your money should only be placed in a Trust Account. 

According to Investopedia, a Trust account is an account that is managed by one party for the benefit of another. It is sometimes called an account held in trust, and the trust relationship can be either explicit or implied. It is usually administered by a bank and the account name would state that it is a Trust Account.

The fund manager that you have appointed simply gives instruction to manage the funds on your behalf without being able to withdraw or touch the money at all. That is the minimum safeguard that you must have and you will not have the risk of someone sweeping your money away without leaving any traces.

Rule 1: If you are asked to transfer money or write a cheque to any account other than a trust account, run for the exit, unless you trust the person who asked for the transfer with your life.

My Own Advise

Never succumb yourself to the time pressure or "the fear of loss". If you think that you are being pressured to make a quick decision because the "opportunity" is now or never, ask yourself the following questions:
1. Have I fully understood what this investment is about?
2. Do I know how the returns are generated?
3. Does the rate of return make sense to me?
4. Do I understand the risk of the investment? (Under what circumstances will this investment fail?)
5. Do I know the motive of the person recommending the investment to me?
6. Is his interest aligned to mine? (What does he stand to lose when my investment fails?)
7. Have I seek a second opinion from another qualified individual?
8. Can I afford to lose this money?

If any of your answers to the above question is "No", then you should not invest and should walk away. There will always be another opportunity. Do your homework properly and not follow your emotions. It is not worth taking risks that you are not even aware you are taking.

5 Laws of Gold 

Here are the 5 Laws of Gold from the book: The Richest Man in Babylon
  1. Gold cometh gladly and in increasing quantity to any man who will put by not less than one-tenth of his earnings to create an estate for his future and that of his family.
  2. Gold laboreth diligently and contentedly for the wise owner who finds for it profitable employment, multiplying even as the flocks of the field.
  3. Gold clingeth to the protection of the cautious owner who invests it under the advice of men wise in its handling.
  4. Gold slippeth away from the man who invests it in businesses or purposes with which he is not familiar or which are not approved by those skilled in its keep.
  5. Gold flees the man who would force it to impossible earnings or who followeth the alluring advice of tricksters and schemers or who trusts it to his own inexperience and romantic desires in investment.
Age old wisdom stands the test of time, to remain relevant even in our sophisticated society.

Thank you for reading. Please share this post with your friends and family if you find it useful. If you have any comments or feed backs, please post them in the comment section below or drop me an email at ohhanwee@gmail.com.


Disclaimer
This publication is for general reading only. The information and materials contained on this web site are subject to change without notice, are provided for general information only and should not be used as a basis for making investment decisions. It does not form part of any offer or recommendation, or have any regard to the investment objectives, financial situation or needs of any specific person. Before committing to an investment, please seek advice from a financial or other professional adviser regarding the suitability of the product for you and read the relevant product offer documents. I am not liability and will not be liable for any loss or damage arising directly or indirectly (including special, incidental or consequential loss or damage) from your use of this web site, howsoever arising, including any loss, damage or expense arising from, but not limited to, any defect, error, imperfection, fault, omission, mistake or inaccuracy with this web site, its contents or associated services, or due to any unavailability of the web site or any part thereof or any contents or associated services.


Monday 28 March 2016

[N01] Nera Telecommunication 2016 Analysis


Price to Buy: S$0.107 [Overvalued]
Valuation Valid until release of 31 December 2016 Annual Report

COMPANY OVERVIEW


NeraTel is a premier solutions provider with
the technological expertise to provide proven solutions, the commitment to offer excellent customer service and localisation of resources in each market it operates. We live in a world of instant communications - anytime and anywhere. Computers, telephones, cellular phones, Internet, Intranet, satellites, radio, ATM systems and more have shrunk the world we live in, creating a global village. Everything is linked and information is available at our fingertips - regardless of our location. Even as technology has redefined the concept of convenience, we continue to search for more effective communications tools - to bring us to a stage where communications is effortless.


VALUATION


Valuation is obtained by using an algorithm to project next 5 years' financial data based on past 5 year's data trend. Based on the trajectory, predicted dividends, owner's earnings and free cash flows are obtained to derive a range of discounted cash flow valuation. The terminal value used in the calculation is the projected Net-Net of the company after 5 years, on the assumption that we are liquidating the company.

Although past results does not necessarily equal to future performances, when there is a track record, the chances of similar results happening in future is higher. The concept is to project specific line drivers in the balance sheet, income statement, and cash flow statement and model the respective changes to the bottom line. 

For margin of safety, a very high discount rate of 18.45% is used when discounting cash flows. The discount rate is the expected return for doubling an investment in 5 years, adjusted for an inflation of 3% each year. The final calculated intrinsic value is further discounted by another 20%.

This valuation method is applied unilaterally to all the companies in my screener and the predictions are best applicable for companies with strong Profitability, Financial health and Sustainability which translates into consistency. Consistency is the key ingredient for more accurate predictions and higher probability of derived value being right.

Net-net per share is derived by discounting each category of balance sheet items according to liquidation value estimates. The final sum of all items is divided by the total number of shares to derive a price of S$0.038 per share. This is the price each equity shareholder is entitled to if the company is forced to liquidate, after repaying all its debt and liabilities. 


NeraTel is valued at an intrinsic value of S$0.133. With a margin of safety of 20%, the price to buy is anything less than S$0.107At the current price of S$0.545, NeraTel is deemed as overvalued to me because it is not able to deliver my expected returns.

For further understanding of the thoughts behind the valuation, please check out this article on how should stock investments be valued.

PROFITABILITY


A variety of financial ratios were used to construct the above profitability indicators with the purpose of simplifying analysis of financial statement data. The fresh green indicators denotes that the benchmark is exceeded while yellowing-green to red denotes the degree of the indicator falling below benchmark. 


The above histogram shows the simple profitability measurement of various components in the income statement. Revenue (blue) and profit margin (yellow) has sort of plateaued for the past 3 years, indicating that NeraTel may have very limited growth opportunities. Cost of goods sold (COGS - orange) is the variable cost that increases as revenue increase has shown to be consistent throughout the years. Sales & General Administrative Expenses (SG&A - grey) are the fixed cost of running the business regardless of revenue has also been kept at the same level. Profit Margin has been consistently below 15% for the past 5 years, which indicates that this company does not really have very strong pricing power.


Positive free-cash-flow (FCF) indicates that the company is able to generate enough cash to fund its capital expenditures and investments with enough leftover for shareholders. As seen from the above histogram, although NeraTel has been able to generate positive FCF for the past 5 years, there is a very obvious downtrend oweing to a decline in net operating cash flow.

FINANCIAL HEALTH


Companies with very high profits and profit margins, but are heavily in debt, are very risky companies that might turn into loss-making companies or even bankrupt in the event of economic downturn. Hence, having indicators that warns us of risky companies are important so that we are informed of the risk we are buying into. The more indicators above that are highlighted green indicates a healthier company with a low risk balance sheet. Healthy companies can weather economic downturn or interest rate increases much better in terms of having a less volatile share price. 


The above histogram shows the capital structure of the company over the past 5 years. It is important to note that liabilities are not the same as debt, but debt is definitely a part of liability. The more equity (orange) you see, the better, because equity is what you own as a shareholder. The lesser the debt (grey), means that the company is less likely to declare bankrupt because only companies that are unable to repay their debt will be forced to declare bankrupt. 

NeraTel has increased its debt from $S4.7mil in FY2014 to S$16.3mil FY2015 and its equity has declined from a high of S$66mil in FY2013 to S$56mil in FY2015. Total Liabilities have increased steadily over the years which is a sign that the balance sheet is becoming heavier.

SUSTAINABILITY


We love companies that can sustain the profit over the years, instead of one that is profitable only for 1 or 2 years before slumping into loss making territory again. Hence, the above indicators help us to identify such companies. 4P score, Piotrosky F score, Financial Strength, and Asset Turnover growth score are the 4 Quant Value indicators that tells us how a company has performed over the years. Margin Growth / Margin Stability are 2 bipolar indicators to tell us whether this company is a growth stock or a matured stock. 

NeraTel has a margin stability of 5.9 and margin growth of 9.9%, indicating that its profit margin has been quite stable and there is some margin growth over the years.  


The above histogram gives us an indication of whether there is a sudden change in the operations of the company by exhibiting the trends of each of the components in the working capital. Generally, we would like to see more receivables (yellow) than payables (orange) which indicates that the company is expecting to collect more money than it is expect to pay up. However, too much receivables may indicate that the company might be having trouble collecting its dues. Other current liabilities (peach) may include items such as Accruals, Unearned Revenue, PP&E Vendor, Deferred Income, Deposits from Customers, Mark-to-Market Instrument etc.

Working capital for NeraTel has been pretty consistent for the past 5 years


To find out whether the company is having issues collecting the money that its customers owe, we can use the Account receivable days (yellow) over the years to inform us of the trend. An uptrend is a bad sign that more customers are having difficulty paying or that the company is extending looser credit terms. 

Both the Account receivable days (yellow) and Accounts payable days (orange) are above the 180 days range which might mean that the company is having slow cash flow. This might be a bad thing in a slow economy.

Inventory days (grey) has remained within 30 days, indicating that NeraTel has very little inventory and they are moving out of the warehouse within a month on average.

SUMMARY

NeraTel has a consistent profit margin, but at a low range of less than 15% for the past 5 years. It has declining but positive FCF for the past 5 FYs and pays dividend twice a year. The company's balance sheet is becoming heavier with more liabilities and debt issuance has increased from FY2014. Overall, NeraTel seemed like a company in decline. HenceNeraTel is deemed to be overvalued and its recommended purchase price is S$0.107

Do check out my list of company recommendations for 2016 here

Official Company Website: http://www.neratel.com.sg/
Company's Dividend History: http://sgxdata.pebbleslab.com/index.asp?m=2&NC=N01
Financial Statement Data Source: https://online.capitalcube.com/#!/stock/sg/singapore/N01/financials


Thank you for reading and please share it as a form of encouragement for my effort. If you have any comments or feed backs, please post them in the comment section below. 


Do check out my analysis of other companies: http://fundamentally-invest.blogspot.sg/p/blog-page.html

Disclaimer

This publication is for general reading only. The information and materials contained on this web site are subject to change without notice, are provided for general information only and should not be used as a basis for making investment decisions. It does not form part of any offer or recommendation, or have any regard to the investment objectives, financial situation or needs of any specific person. Before committing to an investment, please seek advice from a financial or other professional adviser regarding the suitability of the product for you and read the relevant product offer documents. I am not liability and will not be liable for any loss or damage arising directly or indirectly (including special, incidental or consequential loss or damage) from your use of this web site, howsoever arising, including any loss, damage or expense arising from, but not limited to, any defect, error, imperfection, fault, omission, mistake or inaccuracy with this web site, its contents or associated services, or due to any unavailability of the web site or any part thereof or any contents or associated services.

Sunday 27 March 2016

[5CP] Silverlake Axis Limited 2016 Analysis


Price to Buy: S$0.18 [Overvalued]
Valuation Valid until release of 30 June 2016 Annual Report

COMPANY OVERVIEW


Silverlake Axis creates technologies to enable the Digital Economy. What sets this company apart is the foundation for their computing principles, which are grounded on mathematical models. Through the years, Silverlake Axis has evolved using mathematics to refine, expand and invent technologies, broadening into new industries and markets at the same time.

Founded in 1989, Silverlake Axis has built an impeccable track record of successful core banking implementations. Over 40% of the top 20 largest banks in South-East Asia run the Silverlake Axis core banking solution, and today, they are the core system platform partner of choice for 3 of the 5 largest ASEAN super regional financial institutions.

Today, Silverlake Axis centres its business around Digital Economy Transformation. Rapidly venturing beyond our strength in core banking systems, Silverlake Axis has successfully entered through partnership and re-invention of their capabilities to put themselves in the front and centre of Digital Economy. Their Digital Economy Transformation is driven by the Silverlake Collaborative Capability and Intelligence Model (SCCIM).

The Silverlake Collaborative Architecture is the foundation in which boundaries of computing can be determined by economic rationale of demand and supply rather than by technical limits. It is the driver for transformation both within Silverlake Axis and their customers. Their SCCIM enabled solutions are configurable to meet a set of business objectives and act as enablers for transformation and business agility.

Silverlake Axis' SCCIM technologies enable the financial, business, social relationships for Digital Economy, and delivers through four capabilities Collaborative Computing, Mobility, Intelligence and Cloud. Our Ecosystem Offerings cut across Banking & Finance, Insurance, Retail, Education, Healthcare and Hospitality among others.


VALUATION


Valuation is obtained by using an algorithm to project next 5 years' financial data based on past 5 year's data trend. Based on the trajectory, predicted dividends, owner's earnings and free cash flows are obtained to derive a range of discounted cash flow valuation. The terminal value used in the calculation is the projected Net-Net of the company after 5 years, on the assumption that we are liquidating the company.

Although past results does not necessarily equal to future performances, when there is a track record, the chances of similar results happening in future is higher. The concept is to project specific line drivers in the balance sheet, income statement, and cash flow statement and model the respective changes to the bottom line. 

For margin of safety, a very high discount rate of 18.45% is used when discounting cash flows. The discount rate is the expected return for doubling an investment in 5 years, adjusted for an inflation of 3% each year. The final calculated intrinsic value is further discounted by another 20%.

This valuation method is applied unilaterally to all the companies in my screener and the predictions are best applicable for companies with strong Profitability, Financial health and Sustainability which translates into consistency. Consistency is the key ingredient for more accurate predictions and higher probability of derived value being right.

Net-net per share is derived by discounting each category of balance sheet items according to liquidation value estimates. The final sum of all items is divided by the total number of shares to derive a price of S$0.092 per share. This is the price each equity shareholder is entitled to if the company is forced to liquidate, after repaying all its debt and liabilities. 


Silverlake is valued at an intrinsic value of S$0.25. As the valuation is based on the reported figures in its June 2015 annual report, after discounting the total S$0.0255 dividend paid since 17 Nov 2015, the adjusted intrinsic value of Silverlake is S$0.225. With a margin of safety of 20%, the price to buy is anything less than S$0.18At the current price of S$0.61, Silverlake is deemed as overvalued to me because it is not able to deliver my expected returns.

For further understanding of the thoughts behind the valuation, please check out this article on how should stock investments be valued.

PROFITABILITY


A variety of financial ratios were used to construct the above profitability indicators with the purpose of simplifying analysis of financial statement data. The fresh green indicators denotes that the benchmark is exceeded while yellowing-green to red denotes the degree of the indicator falling below benchmark. 


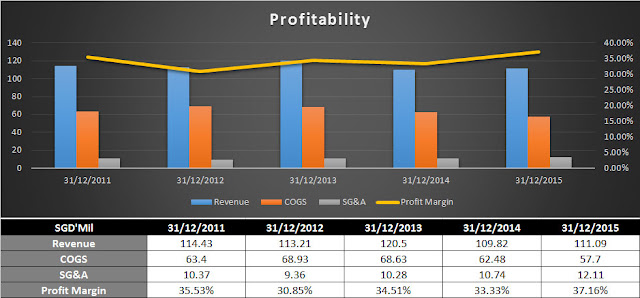
The above histogram shows the simple profitability measurement of various components in the income statement. Revenue (blue) and profit margin (yellow) has sort of plateaued for the past 3 years, indicating that Silverlake Axis may have very limited growth opportunities. Cost of goods sold (COGS - orange) is the variable cost that increases as revenue increase has shown to be consistent throughout the years. Sales & General Administrative Expenses (SG&A - grey) are the fixed cost of running the business regardless of revenue has also been kept at the same level. Profit Margin has maintained at around the range of 50% for the past 5 years, which indicates that this company has very strong pricing power.


Positive free-cash-flow (FCF) indicates that the company is able to generate enough cash to fund its capital expenditures and investments with enough leftover for shareholders. As seen from the above histogram, Silverlake Axis has been able to generate positive FCF for the past 5 years.

FINANCIAL HEALTH


Companies with very high profits and profit margins, but are heavily in debt, are very risky companies that might turn into loss-making companies or even bankrupt in the event of economic downturn. Hence, having indicators that warns us of risky companies are important so that we are informed of the risk we are buying into. The more indicators above that are highlighted green indicates a healthier company with a low risk balance sheet. Healthy companies can weather economic downturn or interest rate increases much better in terms of having a less volatile share price. 

All of Silverlake Axisfinancial health indicators are above the benchmark, which means that the company is extremely healthy. 


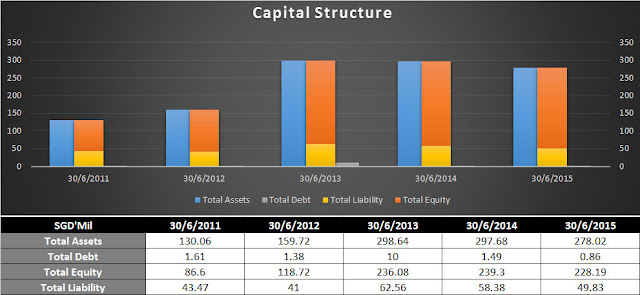
The above histogram shows the capital structure of the company over the past 5 years. It is important to note that liabilities are not the same as debt, but debt is definitely a part of liability. The more equity (orange) you see, the better, because equity is what you own as a shareholder. The lesser the debt (grey), means that the company is less likely to declare bankrupt because only companies that are unable to repay their debt will be forced to declare bankrupt. 

Silverlake Axis has no debt and very little liabilities, but the company has not been growing for the past 3 years and even shrunk from S$297mil in FY2014 to S$278mil in FY2015. 

SUSTAINABILITY


We love companies that can sustain the profit over the years, instead of one that is profitable only for 1 or 2 years before slumping into loss making territory again. Hence, the above indicators help us to identify such companies. 4P score, Piotrosky F score, Financial Strength, and Asset Turnover growth score are the 4 Quant Value indicators that tells us how a company has performed over the years. Margin Growth / Margin Stability are 2 bipolar indicators to tell us whether this company is a growth stock or a matured stock. 

Silverlake Axis has a margin stability of 14.6 and margin growth of 2.5%, indicating that its profit margin has been very stable and there is very little margin growth over the years.  


The above histogram gives us an indication of whether there is a sudden change in the operations of the company by exhibiting the trends of each of the components in the working capital. Generally, we would like to see more receivables (yellow) than payables (orange) which indicates that the company is expecting to collect more money than it is expect to pay up. However, too much receivables may indicate that the company might be having trouble collecting its dues. Other current liabilities (peach) may include items such as Accruals, Unearned Revenue, PP&E Vendor, Deferred Income, Deposits from Customers, Mark-to-Market Instrument etc.

We can see a drop in account receivables from FY2013 to FY2015 which is a sign of slowing business. 


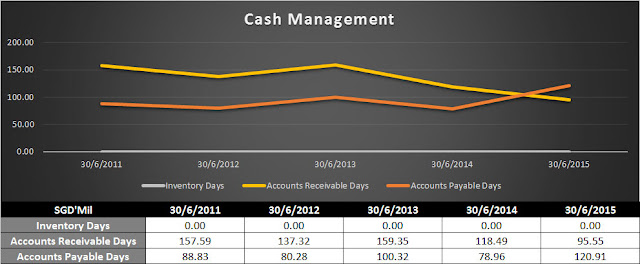
To find out whether the company is having issues collecting the money that its customers owe, we can use the Account receivable days (yellow) over the years to inform us of the trend. An uptrend is a bad sign that more customers are having difficulty paying or that the company is extending looser credit terms. 

Account receivable days has dropped from 160 days in FY2011 to less than 100 days in FY2015. However, taking 3 months to receive payment means that Silverlake Axis might have tighter cash flow to make payments to its suppliers.

Accounts payable days (orange) tells us whether the company is having difficulty paying off its dues to its suppliers. Account payable days spiked from 78 days in FY2014 to 120 days in FY2015, indicating that Silverlake Axis might be having issues making payments.

Inventory days (grey) is showing an uptrend, indicating that there is a slow down in inventory movements due to slower sales or there is an increase in inventory in anticipation of more sales volume. Silverlake Axis has no inventory

SUMMARY

Silverlake Axis has a very consistent profit margin of about 50% for the past 5 years. It has also managed to achieve positive FCF for the past 5 FYs and paying dividend 4 times a year. The company has been very healthy for the past 5 years with very light balance sheets and very little debt. It has consistent and predictable working capital and has demonstrated that it is a very sustainable business. HoweverSilverlake Axis is deemed to be overvalued and its recommended purchase price is S$0.18

Do check out my list of company recommendations for 2016 here

Official Company Website: http://www.silverlakeaxis.com/
Company's Dividend History: http://sgxdata.pebbleslab.com/index.asp?m=2&NC=5CP
Financial Statement Data Source: https://online.capitalcube.com/#!/stock/sg/singapore/5CP/financials


Thank you for reading and please share it as a form of encouragement for my effort. If you have any comments or feed backs, please post them in the comment section below. 


Do check out my analysis of other companies: http://fundamentally-invest.blogspot.sg/p/blog-page.html

Disclaimer

This publication is for general reading only. The information and materials contained on this web site are subject to change without notice, are provided for general information only and should not be used as a basis for making investment decisions. It does not form part of any offer or recommendation, or have any regard to the investment objectives, financial situation or needs of any specific person. Before committing to an investment, please seek advice from a financial or other professional adviser regarding the suitability of the product for you and read the relevant product offer documents. I am not liability and will not be liable for any loss or damage arising directly or indirectly (including special, incidental or consequential loss or damage) from your use of this web site, howsoever arising, including any loss, damage or expense arising from, but not limited to, any defect, error, imperfection, fault, omission, mistake or inaccuracy with this web site, its contents or associated services, or due to any unavailability of the web site or any part thereof or any contents or associated services.

Saturday 26 March 2016

[558] UMS Holdings Limited 2016 Analysis


Price to Buy: S$0.311[Overvalued]
Valuation Valid until release of 31 December 2016 Annual Report

COMPANY OVERVIEW


UMS is a precision engineering group which specializes in manufacturing high precision front-end semiconductor components and perform complex electromechanical assembly and final testing services. Included in our core business is the production of modular and integration systems for original semiconductor equipment manufacturers. Aside from semiconductor industry, it also caters to other industries including in electronic, machine tools, aerospace and oil & gas industries.

The company has been in the industry for more than 20 years and has established itself to be one of the leaders in the semiconductor industry in providing front-end high precision components to original equipment manufacturers and offering the best in class solutions. To stay competitive, it continually invest in R&D to respond rapidly and effectively to customer needs. Currently, it is qualified for more than 70 special processes in the production of components for semiconductor equipment manufacturers. Some of the special processes are anodizing, plating, and chemical cleaning.

With state of the art machining centres and flexible manufacturing systems, UMS can cater to a wide range of product sizes. Supported by experienced engineering and manufacturing team in precision machining, it supports and work closely with customers on New Project Implementation (NPI), continuous process improvement (CPI) and development of new processes and technology.

UMS is a strategic OEM with providing fully integrated solutions for factory automation equipment, standalone equipment, and precision machining parts. Its main technology partner includes a US-based manufacturing company.


VALUATION


Valuation is obtained by using an algorithm to project next 5 years' financial data based on past 5 year's data trend. Based on the trajectory, predicted dividends, owner's earnings and free cash flows are obtained to derive a range of discounted cash flow valuation. The terminal value used in the calculation is the projected Net-Net of the company after 5 years, on the assumption that we are liquidating the company.

Although past results does not necessarily equal to future performances, when there is a track record, the chances of similar results happening in future is higher. The concept is to project specific line drivers in the balance sheet, income statement, and cash flow statement and model the respective changes to the bottom line. 

For margin of safety, a very high discount rate of 18.45% is used when discounting cash flows. The discount rate is the expected return for doubling an investment in 5 years, adjusted for an inflation of 3% each year. The final calculated intrinsic value is further discounted by another 20%.

This valuation method is applied unilaterally to all the companies in my screener and the predictions are best applicable for companies with strong Profitability, Financial health and Sustainability which translates into consistency. Consistency is the key ingredient for more accurate predictions and higher probability of derived value being right.

Net-net per share is derived by discounting each category of balance sheet items according to liquidation value estimates. The final sum of all items is divided by the total number of shares to derive a price of S$0.338 per share. This is the price each equity shareholder is entitled to if the company is forced to liquidate, after repaying all its debt and liabilities. 


UMS is valued at an intrinsic value of S$0.389. With a margin of safety of 20%, the price to buy is anything less than S$0.311At the current price of S$0.56, UMS is deemed as overvalued.

For further understanding of the thoughts behind the valuation, please check out this article on how should stock investments be valued.

PROFITABILITY


A variety of financial ratios were used to construct the above profitability indicators with the purpose of simplifying analysis of financial statement data. The fresh green indicators denotes that the benchmark is exceeded while yellowing-green to red denotes the degree of the indicator falling below benchmark. 


The above histogram shows the simple profitability measurement of various components in the income statement. Revenue (blue) and profit margin (yellow) as been consistent for the past 5 years, indicating that UMS may have very limited growth opportunities. Cost of goods sold (COGS - orange) is the variable cost that increases as revenue increase has shown to be consistent throughout the years. Sales & General Administrative Expenses (SG&A - grey) are the fixed cost of running the business regardless of revenue has also been kept at the same level. Profit Margin has maintained at above 30% for the past 5 years


Positive free-cash-flow (FCF) indicates that the company is able to generate enough cash to fund its capital expenditures and investments with enough leftover for shareholders. As seen from the above histogram, UMS has been able to generate positive FCF for the past 5 years.

FINANCIAL HEALTH


Companies with very high profits and profit margins, but are heavily in debt, are very risky companies that might turn into loss-making companies or even bankrupt in the event of economic downturn. Hence, having indicators that warns us of risky companies are important so that we are informed of the risk we are buying into. The more indicators above that are highlighted green indicates a healthier company with a low risk balance sheet. Healthy companies can weather economic downturn or interest rate increases much better in terms of having a less volatile share price. 

All of UMS's financial health indicators are above the benchmark, which means that the company is extremely healthy. 


The above histogram shows the capital structure of the company over the past 5 years. It is important to note that liabilities are not the same as debt, but debt is definitely a part of liability. The more equity (orange) you see, the better, because equity is what you own as a shareholder. The lesser the debt (grey), means that the company is less likely to declare bankrupt because only companies that are unable to repay their debt will be forced to declare bankrupt. 

UMS has no debt and very little liabilities, but the company has not been growing, with total assets hover around S$210mil. 

SUSTAINABILITY


We love companies that can sustain the profit over the years, instead of one that is profitable only for 1 or 2 years before slumping into loss making territory again. Hence, the above indicators help us to identify such companies. 4P score, Piotrosky F score, Financial Strength, and Asset Turnover growth score are the 4 Quant Value indicators that tells us how a company has performed over the years. Margin Growth / Margin Stability are 2 bipolar indicators to tell us whether this company is a growth stock or a matured stock. 

UMS has a margin stability of 14.4 and margin growth of 1.1%, indicating that its margin is very stable and there is almost no margin growth over the years.  


The above histogram gives us an indication of whether there is a sudden change in the operations of the company by exhibiting the trends of each of the components in the working capital. Generally, we would like to see more receivables (yellow) than payables (orange) which indicates that the company is expecting to collect more money than it is expect to pay up. However, too much receivables may indicate that the company might be having trouble collecting its dues. Other current liabilities (peach) may include items such as Accruals, Unearned Revenue, PP&E Vendor, Deferred Income, Deposits from Customers, Mark-to-Market Instrument etc.

The working capital of UMS has been pretty consistent. 


To find out whether the company is having issues collecting the money that its customers owe, we can use the Account receivable days (yellow) over the years to inform us of the trend. An uptrend is a bad sign that more customers are having difficulty paying or that the company is extending looser credit terms. 

UMS's customers are generally paying up within 2 months, which is very beneficial to its cash flow and represent lesser occurrence of bad debt.

Accounts payable days (orange) tells us whether the company is having difficulty paying off its dues to its suppliers. UMS has been paying its suppliers also generally within 60 days which can help it to secure better credit terms and reducing its cost.

Inventory days (grey) is showing an uptrend, indicating that there is a slow down in inventory movements due to slower sales or there is an increase in inventory in anticipation of more sales volume.

SUMMARY

UMS has a very consistent profit margin of above 30% for the past 5 years. It has also managed to achieve positive FCF for the past 5 FYs and paying dividend every quarter. The company has been very healthy for the past 5 years with very light balance sheets and very little debt. It has consistent and predictable working capital and has demonstrated that it is a very sustainable business. However, UMS is deemed to be overvalued and its recommended purchase price is S$0.311

Do check out my list of company recommendations for 2016 here

Official Company Website: http://www.umsgroup.com.sg/
Company's Dividend History: http://sgxdata.pebbleslab.com/index.asp?m=2&NC=558
Financial Statement Data Source: https://online.capitalcube.com/#!/stock/sg/singapore/558/financials


Thank you for reading and please share it as a form of encouragement for my effort. If you have any comments or feed backs, please post them in the comment section below. 


Do check out my analysis of other companies: http://fundamentally-invest.blogspot.sg/p/blog-page.html

Disclaimer

This publication is for general reading only. The information and materials contained on this web site are subject to change without notice, are provided for general information only and should not be used as a basis for making investment decisions. It does not form part of any offer or recommendation, or have any regard to the investment objectives, financial situation or needs of any specific person. Before committing to an investment, please seek advice from a financial or other professional adviser regarding the suitability of the product for you and read the relevant product offer documents. I am not liability and will not be liable for any loss or damage arising directly or indirectly (including special, incidental or consequential loss or damage) from your use of this web site, howsoever arising, including any loss, damage or expense arising from, but not limited to, any defect, error, imperfection, fault, omission, mistake or inaccuracy with this web site, its contents or associated services, or due to any unavailability of the web site or any part thereof or any contents or associated services.