This company is recommended on the list of very good companies with strong fundamentals in 2016
Price to Buy: S$0.407 [Fair Valued]
Valuation Valid until release of 31 December 2016 Annual Report
COMPANY OVERVIEW
The company's core competitive advantage lies in its ability to utilize a myriad of latest technologies, innovative methodologies and ideas to produce premium furniture products of unrivalled quality and workmanship.
Design Studio's three complementary and versatile core businesses - the supply and installation of manufactured furniture products to private residential developments; interior fitting-out services to hospitality and commercial projects through our wholly owned subsidiary DDS Group and distributorship of renowned imported brand SieMatic in Singapore and the export of widely received in-house brand PANELZ which have since gained regional recognition.
Design Studio has also established their first retail sales show room in Dongguan, Guangzhou China whereby discerning individual home owners in China can now have a direct encounter with our products and experienced first-hand professional consultation.
VALUATION
Design Studio is valued at an intrinsic value of S$0.508. With a margin of safety of 20%, the price to buy is anything less than S$0.407. At the current price of S$0.505, Design Studio is deemed as fairly valued.
Net-net per share is derived by discounting each category of balance sheet items according to liquidation value estimates. The final sum of all items is divided by the total number of shares to derive a price of S$0.24 per share. This means that if the company is forced to liquidate, after repaying all its debt and liabilities, each equity shareholder is entitled to S$0.24 per share.
PROFITABILITY
A variety of financial ratios were used to construct the above profitability indicators with the purpose of simplifying analysis of financial statement data. The fresh green indicators denotes that the benchmark is exceeded while yellowing-green to red denotes the degree of the indicator falling below benchmark.
The above histogram shows the simple profitability measurement of various components in the income statement. Revenue (blue) is showing a slight decline together with profit margin (yellow), indicating that the company is experiencing slower business.
Although revenue and profit margin has fallen slightly, this could be due to the general slowdown in the economy.
Positive free-cash-flow (FCF) indicates that the company is able to generate enough cash to fund its capital expenditures and investments with enough leftover for shareholders. As seen from the above histogram, Design Studios has been able to generate a healthy amount of FCF each year. for the past 5 years.
FINANCIAL HEALTH
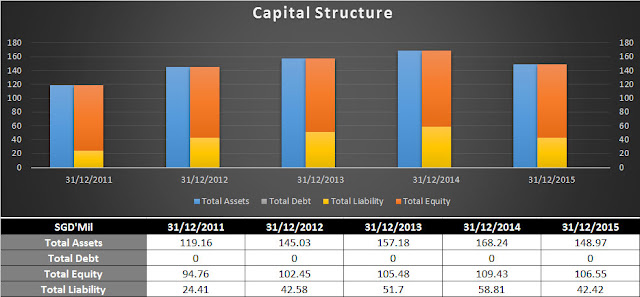
Design Studios has no debt and has achieved above benchmark scores for its Financial Health indicators.
The above histogram shows the capital structure of the company over the past 5 years. It is important to note that liabilities are not the same as debt, but debt is definitely a part of liability. The more equity (orange) you see, the better, because equity is what you own as a shareholder. The lesser the debt (grey), means that the company is less likely to declare bankrupt because only companies that are unable to repay their debt will be forced to declare bankrupt.
From the above graph, we can see that Design Studio has been farily consistent in its capital structure. It shrunk in FY2015 mainly due to a reduction in liabilities. Consistent companies are the best subject for predictive modeling.
SUSTAINABILITY
Design Studio's margin growth of -9.1% is indication that its profit margin is on a downtrend for the past 5 years while a margin stability of 3.85 is indication that its profit margin is still fluctuating. All of the other indicators are around their respective benchmarks, which shows that this company has been performing rather consistently over the years.
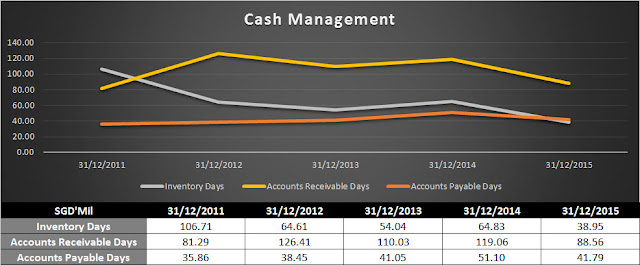
The above histogram gives us an indication of whether there is a sudden change in the operations of the company by exhibiting the trends of each of the components in the working capital. Generally, we would like to see more receivables (yellow) than payables (orange) which indicates that the company is expecting to collect more money than it is expect to pay up. However, too much receivables may indicate that the company might be having trouble collecting its dues.
We can see a decline in accounts receivables and payables from FY2014 to FY2015 as well as a decrease in working capital. Other than that, there is no sign that operations is experience any turbulent changes.
To find out whether the company is having issues collecting the money that its customers owe, we can use the Account receivable days (yellow) over the years to inform us of the trend. An uptrend is a bad sign that more customers are having difficulty paying or that the company is extending looser credit terms.
This company's customers are generally paying up within 120 days, which is quite acceptable as it still falls well within the financial year.
Accounts payable days (orange) tells us whether the company is having difficulty paying of its dues to its suppliers. An uptrend tells us that the company might not be generating enough cashflow. Design Studio has been paying its suppliers within 60 days.
The decline in inventory days is a sign that inventories are moving faster out of their warehouse. Coupled with the fall in receivable and payable days, these are good signs that business is good and there is strong cashflow to meet its business obligations.
SUMMARY
Design Studio has a steady profit margin of above 10% for the past 5 years. It has very strong financial health and exhibited very reliable signs that its business is highly sustainable. Having delivered positive FCF for the past 5 years with zero debt, as well as having very consistent cash management, this is a truly remarkable business.
Hence, Design Studio is deemed as fair valued and its recommended purchase price is S$0.407.
Do check out my list of company recommendations for 2016 here.
Official Company Website: http://designstudio.listedcompany.com/
Company's Dividend History: http://sgxdata.pebbleslab.com/index.asp?m=2&NC=D11
Financial Statement Data Source: https://online.capitalcube.com/#!/stock/sg/singapore/D11/financials
Thank you for reading and please share it as a form of encouragement for my effort. If you have any comments or feed backs, please post them in the comment section below.
Do check out my analysis of other companies: http://fundamentally-invest.blogspot.sg/p/blog-page.html
Disclaimer
This publication is for general reading only. The information and materials contained on this web site are subject to change without notice, are provided for general information only and should not be used as a basis for making investment decisions. It does not form part of any offer or recommendation, or have any regard to the investment objectives, financial situation or needs of any specific person. Before committing to an investment, please seek advice from a financial or other professional adviser regarding the suitability of the product for you and read the relevant product offer documents. I am not liability and will not be liable for any loss or damage arising directly or indirectly (including special, incidental or consequential loss or damage) from your use of this web site, howsoever arising, including any loss, damage or expense arising from, but not limited to, any defect, error, imperfection, fault, omission, mistake or inaccuracy with this web site, its contents or associated services, or due to any unavailability of the web site or any part thereof or any contents or associated services.


No comments:
Post a Comment